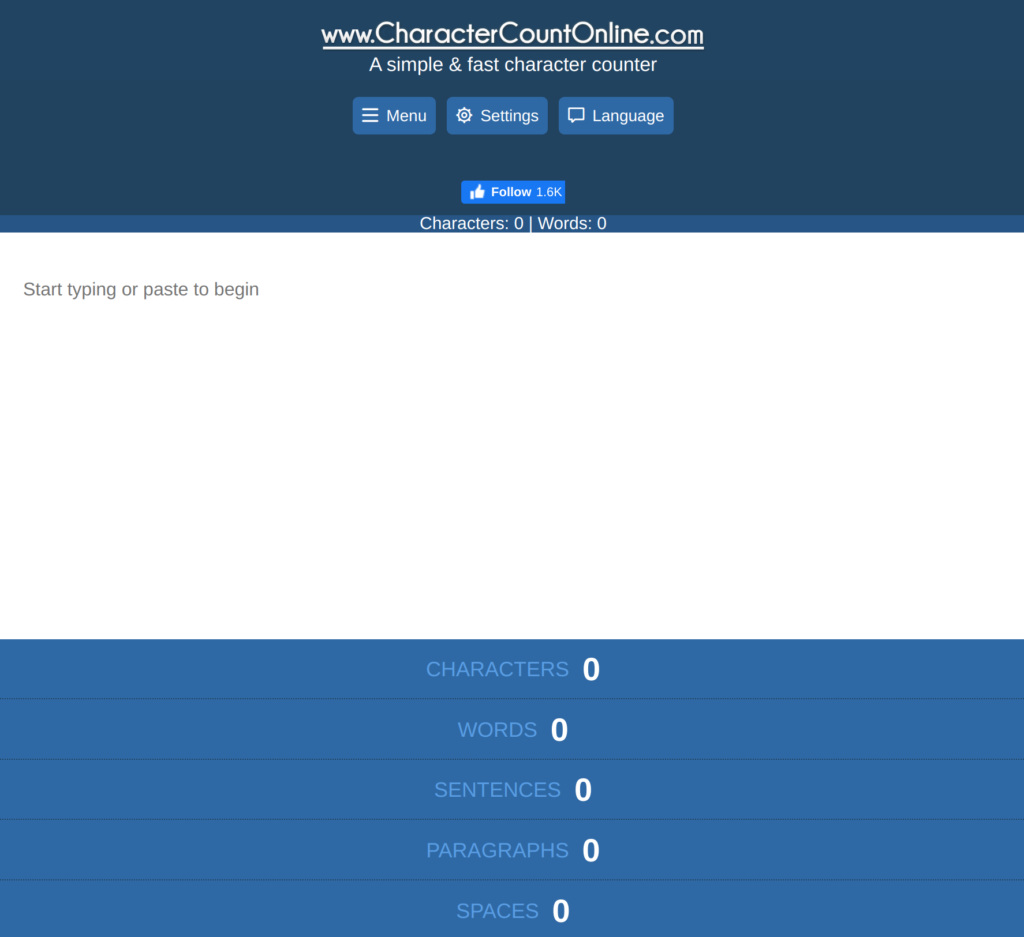
The simple one-page website charactercountonline.com could be coded by anyone with a rudimentary understanding of javascript, and last month (October 2022) it was visited 766,317 times according to Similarweb. The site requires nearly zero maintenance and generates essentially passive ad revenue.
That is why niche websites can be such amazing businesses. In this article, I list 50 niche websites that are getting more than a million visits each month. Use them as inspiration for starting your own cash-flowing niche website business.
| Website | Description | Top Visitor Countries | Monthly Visits (Oct 2022) | Top Non-Branded Organic Search Terms | |
| 1 | allsides.com | Media bias ratings and articles on top stories that focus on where news outlets from different sides agree and disagree | US (88%) Canada (2%) Australia (1%) | 1.05 Million | “media bias chart” “media bias” “news bias chart” |
| 2 | dogtime.com | Dog blog | US (53%) UK (9%) Australia (8%) | 1.74 Million | “dog breeds” |
| 3 | petkeen.com | Informational pet blog | US (61%) UK (6%) Canada (4%) | 3.45 Million | “black horse name ideas” “i moved and my cat is hiding” “psi golden retriever” |
| 4 | knowyourmeme.com | Meme origins and trends | US (30%) UK (4%) Canada (4%) Australia (4%) Philippines (3%) | 18.81 Million | “the one piece is real” “luka tim” “wise mystical tree” |
| 5 | corporatefinanceinstitute.com | Finance blog monetized with certifications and online courses on finance and MS office tools | US (24%) India (11%) UK (5%) | 8.44 Million | “pestel analysis” “ansoff matrix” “swot analysis” |
| 6 | accountingtools.com | Articles, books, courses, and a podcast on accounting and finance | US (30%) Philippines (10%) India (10%) Canada (5%) | 1.40 Million | “wage vs salary” “ifrs general principles” “performance materiality” “net operating assets” “accounting concepts” |
| 7 | sodapdf.com | PDF editing, signing, OCR, creation, and image to pdf conversion tools (monetized with paid plans) | India (16%) US (10%) Indonesia (7%) | 4.65 Million | “pdf merge” |
| 8 | pdf2go.com | Free online pdf edit, merge, split, page sort & delete, page rotate, compression, lock/unlock, and conversion tools. Monetization through paid plans to remove limits on maximum processing time, remove ads, use OCR capability, etc. Also ads. | Russia (14%) India (13%) US (8%) | 8.06 Million | “epub to pdf” |
| 9 | compressjpeg.com | Free tool to compress jpeg, jpg, png, gif, and pdf files | India (26%) US (5%) Turkey (5%) | 2.79 Million | “compress jpeg” |
| 10 | worldofbuzz.com | Asian-focused cultural & non-business news (from Pokemon to life hacks to how an Asian mom preferred her son over her daughter). Heavily monetized with ads. | Malaysia (65%) Singapore (8%) US (6%) | 2.84 Million | “umance chong” |
| 11 | arbitersports.com | All-in-one event management tool for high school and college athletic events | US (97%) Canada (3%) | 2.66 Million | *93% of organic searches are branded (e.g. “thearbiter” or “arbiter sports”) |
| 12 | diynot.com | DIY guides and information. Monetized with ads as well as affiliate links for tools and parts. The affiliate links are organized into an online store front UI. | UK (85%) US (3%) Ireland (3%) | 1.47 Million | “rebuilding concrete sill” “ideal 111707” “how to wire a 2 gang light switch” |
| 13 | howtopronounce.com | Pronunciation dictionary, but the site also has celebrity quizzes, travel articles, food and drink articles, and entertainment articles (e.g. “finest comedians in the world” or “best anime of all time”). You can create an account for free which allows you to contribute words, pronunciations, and make quizzes. | U.S. (47%) UK (6%) Canada (4%) | 6.06 Million | “how to pronounce” |
| 14 | nameslook.com | Baby name dictionary (find name meaning, origin, pronunciation, numerology, astrology, etc) | U.S. (41%) UK (6%) Canada (5%) | 1.67 Million | “pett name” |
| 15 | chess24.com | Play chess online, view a calendar of chess events, and read chess-related news. A direct competitor to the much larger chess.com. Heavily monetized with ads. | U.S. (12%) Germany (11%) India (10%) | 7.26 Million | “julius baer generation cup” |
| 16 | wine-searcher.com | Read about wine news, regions, vintages, styles, food pairings, etc. And search for & discover wines, beers, and spirits across thousands of online stores. | U.S. (44%) UK (10%) France (3%) | 5.94 Million | “2008 krug clos du mesnil” |
| 17 | winefolly.com | Articles, guides, courses, a club, and merch related to wine | U.S. (50%) Canada (8%) UK (6%) | 1.22 Million | “types of wine” |
| 18 | wineverygame.com | The site has lots of articles about words, but the biggest traffic draw seems to be the VERY simple scrabble tool that helps you find a word with certain letter patterns, prefixes, suffixes, etc The site seems to be monetized mostly with a few large banner and side bar ads. This site is probably as close to passive income as any business could possibly be. | U.S. (77%) UK (9%) India (7%) | 2.01 Million | “scrabble helper” |
| 19 | boxofficemojo.com | Movie release dates, news, box office performance, and ranked lists of performance (of movies and movie franchises) | U.S. (35%) UK (6%) Canada (5%) | 5.64 Million | “box office” |
| 20 | planetware.com | Travel info, articles, and pictures. They seem to be only monetized with ads. It’s rather surprising to me that I don’t see any affiliate links for travel credit cards or integrations with flight booking websites. | U.S. (48%) UK (8%) Canada (7%) | 6.69 Million | “eiffel tower” “best places to visit in switzerland” “natural wonders of the world” “day trips from rome” |
| 21 | cyberspaceandtime.com | This is a really weird website with a retro-looking UI and terrible on-site navigation. Google shows 3.2 million results for “site:cyberspaceandtime.com”. The home page is just an annotated playlist of 50 recent Youtube video uploads by Michael Leonard. Beyond the home page, the site appears to just be a terrible Youtube video viewer. Yet apparently some people like it since it gets over a million visits per month. | U.S. (40%) Brazil (6%) Canada (5%) | 1.37 Million | “toopy and binoo baby toopy” |
| 22 | racingpost.com | Horse and dog racing results, calendar, news, and articles. Monetization appears to be through affiliate links to betting websites. | UK (81%) Ireland (5%) Brazil (3%) | 9.19 Million | “racing post results” “racing post greyhound” |
| 23 | familyeducation.com | Baby, pregnancy, and marriage articles | US (56%) UK (6%) Canada (5%) | 2.59 Million | “japanese last names” |
| 24 | howtostartanllc.com | This company has articles on LLC formation, registered agents, articles of organization, EIN’s, and other related small business formation topics. The site also has a free business name generator (a classic top-of-marketing-funnel for many businesses that serve small business customers), logo generator, QR code generator, business idea generator, operating agreement creation tool, business plan generator, naics code lookup tool, and an entrepreneurship quiz. The site appears to monetize through an affiliate relationship with one or more LLC formation and registered agent companies. | US (73%) India (3%) UK (2%) | 1.04 Million | “business name generator” “ein lookup” “how to start an llc” “brand name generator” “look up ein” |
| 25 | circuitdigest.com | This site has articles, news, tools, and guides for electronics hobbyists and enthusiasts. Monetization is through ads as well as a relationship with the Digi-Key store for electronic component sales. The circuitdigest site, however, appears to be neglected. The main hamburger navigation button was quite glitchy on a desktop Google Chrome browser. | India (15%) US (15%) Philippines (4%) | 1.26 Million | “servo motor” “circuit calculator” “hex calculator” “hex addition” |
| 26 | synonym.com | Thesaurus that also has a few word games. The website has a sister site ourpastimes.com which hosts additional (non-word) games, but that site only gets about a half million visits per month. Synonym.com is monetized with a few ads, but the experience is not overwhelmed by ads, and not all of the ad slots appear to even be in use. | US (50%) Philippines (6%) UK (4%) | 2.10 Million | “synonyms” “supinate antonyms” |
| 27 | codecanyon.net | A marketplace of thousands of code snippets, scripts, and plugins for website builders. | India (13%) US (7%) Brazil (5%) | 6.31 Million | “classified script” “wowonder” |
| 28 | pythontutor.com | Interactive online python interpreter and step by step visual execution to teach how the code works. Additionally, the site provides similar tools for Javascript, C, C++, and Java | US (16%) Russia (10%) India (6%) | 1.17 Million | “python tutor” “python visualizer” “c tutor” |
| 29 | sleepcalculator.com | An ultra simple one-page website that just asks what time you want to wake up or go to bed and then tells you options for the other. A single banner ad monetizes the site. Google has exactly 1 search result for the site. There are no content marketing blog articles or anything. This is an amazing piece of passive income for whoever owns it. | US (31%) Vietnam (8%) UK (5%) | 2.08 Million | “sleep calculator” “when should i wake up” |
| 30 | watermarkremover.io | Remove watermarks from images for free online (up to 50 images per month). Paid plans allow more images, storage, and even third party integrations. The site has some blog articles and guides about watermarks for SEO purposes. | India (16%) US (10%) Brazil (5%) | 1.53 Million | “watermark remover” “remove watermark” |
| 31 | surf-forecast.com | Widgets, calendars, and maps for surf conditions in various regions. | US (19%) Spain (13%) France (11%) | 4.15 Million | “surf forecast” |
| 32 | bikeradar.com | Bicycling articles, product reviews, and news. | US (32%) UK (19%) Canada (5%) | 4.56 Million | “timemachine 02 bike” “uci gravel” “gravel bike” |
| 33 | wheel-size.com | A simple database frontend widget to search by vehicle type, tire size, or rim size and find matching wheels. The site also has articles about tires and wheels. | US (30%) Canada (20%) Australia (7%) | 2.20 Million | “wheel size” “wheel size calculator” |
| 34 | wheelsjoint.com | Blog with articles on car tips and problem troubleshooting. | US (59%) UK (10%) Canada (7%) | 1.94 Million | “ford fiesta ac slow cooling” “2018 subaru forester what to do if the abs light comes on” “mitsubishi pajero” “05 buick rainier power windows not working” |
| 35 | wheelofnames.com | Simple website app to add names to a wheel that you can then “randomly” spin to get a winner. Simple ad monetization. | US (39%) Philippines (10%) Vietnam (6%) | 9.75 Million | “spin the wheel” “random wheel” |
| 36 | knowyourmobile.com | Mobile phone (tech, plans, buyer’s guides, etc) blog | US (22%) UK (9%) Poland (7%) | 1.13 Million | “iphone size comparison” “iphone sizes” |
| 37 | dappradar.com | Search ranked lists of dapps (blockchain decentralized applications). | US (15%) Russia (5%) Vietnam (5%) | 1.29 Million | “opensea volume” “stablefund” |
| 38 | horseracingnation.com | Horse racing blog / media site. | US (87%) Canada (5%) Saudi Arabia (2%) | 1.27 Million | “cotillion stakes 2022” “delta downs races today” |
| 39 | laptopmag.com | Tech news, reviews, and deals blog. | US (37%) UK (8%) India (7%) | 4.09 Million | “best laptops” “best laptops 2022” “pixel 7” “ipad pro 2022” |
| 40 | startuptalky.com | Unremarkable blog targeting entrepreneurs. | India (56%) US (10%) UK (3%) | 1.17 Million | “apple marketing strategy” “history of spotify” “15 companies that don’t require a degree” |
| 41 | historyofyesterday.com | An unremarkable blog with history articles (e.g. “The true origin of Arab people and culture”) as well as click-bait “science” articles (e.g. “The filthiest part of the human body according to scientists – Not the hole you are expecting”). | US (53%) UK (6%) Brazil (3%) | 8.55 Million | “hisashi ouchi” “americans buying potassium iodide” “elon musk” “how many kids did adam and eve have” |
| 42 | automateexcel.com | This site offers a wide variety of tools, articles, examples, and courses/bootcamps for excel and VBA power users. | US (23%) India (7%) Germany (5%) | 1.96 Million | “sort randomly in excel” “google spread sheet shortcut keyboard remove filter” “excel template with search box” “compound interest formula excel” |
| 43 | exceldemy.com | An excel and VBA blog monetized through consulting and training services (including through udemy), books, and ads. | US (31%) India (6%) UK (6%) | 2.31 Million | “excel vba reference another sheet” “excel vba table reference” “vba save excel file name cell” “how to send emails with microsoft from excel list” |
| 44 | ablebits.com | A blog with tips, tricks, and tutorials on excel, outlook, and other microsoft tools. The site sells a suite of specific tools and add-ons for excel and outlook powerusers. | US (27%) India (9%) UK (6%) | 3.53 Million | “vlookup google sheets” “highlight duplicates in google sheets” “how to keep google spreadsheet filter always full sheet” |
| 45 | freebooksy.com | Find interesting free e books for Kindle, Nook, Apple Books, etc. The site seems to monetize through promoting some paid e books as well. I could imagine another potential way to monetize might be similar to Reese Witherspoon’s book club (i.e. compensation for promoting books) since the site might make books only freely available on certain days, but I have no idea if the site’s owner has implemented such a scheme. | US (73%) Canada (5%) Ecuador (4%) | 1.31 Million | “free kindle romance books” “deadly match by ivy fox epub download” |
| 46 | manybooks.net | Browse and discover books by genre. Free downloads available for many books as pdf or epub. Monetization through ads as well as author services. Authors can pay to promote their free or discounted books or get a featured review in the blog. | US (19%) India (8%) China (6%) | 1.18 Million | “free books online” “free books” |
| 47 | free-ebooks.net | Ebook rankings and articles with many free downloads. | US (18%) India (10%) France (4%) | 1.00 Million | “free ebooks” “free e books” “ebooks free” |
| 48 | thebump.com | Blog on pregnancy, baby, and parenting information and tips | US (62%) UK (6%) Canada (6%) | 7.72 Million | “indian names” “baby name generator” “baby shower games” “boy names” |
| 49 | thecinemaholic.com | TV and movie blog | US (46%) UK (6%) Canada (5%) | 6.52 Million | “bobbi t” “screenwriter starlet” “screenwriter starlet joke” “errol lindsey” “steven hicks” |
| 50 | thedelite.com | This website is a random hodgepodge of articles with no unifying theme. Every article is clearly designed to either rank on Google (e.g. “every us commander-in-chief ranked” or “most valuable collector’s items in the world”) or to do well on social media (e.g. “haunting images declassified by the CIA” and “jealousy captured at the right moment”) | US (94%) Canada (2%) UK (1%) | 3.26 Million | “best boxers of all time” “best songs of all time” “greatest boxers of all time” “top 10 songs of all time” |