“Before Ramsey started promoting Timeshare Exit Team on his show, the company was doing less than $1 million in annual sales. Five years later, the company was doing over $40 million in annual sales, and Ramsey allegedly earned more than $30 million during that time for promoting it.”

Dave Ramsey–the billionaire OG personal finance influencer–is facing a $150 million class-action lawsuit for promoting a “timeshare exit services” company on his radio show for almost 6 years, from 2015 to 2021.
The lawsuit was filed by 17 Ramsey Show listeners who followed Dave’s advice to hire Reed Hein & Associates (a.k.a. the “Timeshare Exit Team”) to help them get out of their timeshare contracts.
There are many good reasons for the bad reputation of timeshares. One reason is that timeshares bought directly from developers typically lose 90+% of their resale value the moment you buy them (like buying a new car, but WAY worse). Another reason is that timeshares are often marketed as investments, but most are just memberships that don’t give you any fractional ownership of the actual underlying resort property.
Yet another reason that timeshares have a bad reputation is that timeshare salespeople use high-pressure sales tactics (such as spending 10 minutes on the phone with no one, pretending to talk their boss into a price that is more than 50% lower than what the salesperson initially pitched you).

Oh, and don’t forget, timeshares often cost $30,000 to $100,000, are financed by the timeshare companies with a 15-20% interest rate, come bundled with mandatory maintenance fees that average over $1,000 per year and increase every year, and typically have hidden “exchange” fees that you must pay to use them at the locations you thought were already included in the purchase price. Timeshares are HUGE financial liabilities advertised as luxury investment assets, with restrictions that end up preventing most people who buy them from even being able to use them. So, it’s understandable why Dave Ramsey doesn’t like them.
In fact, he dislikes them so much, he told his listeners for almost 6 years, that if they owned a timeshare, they should hire the Timeshare Exit Team to help them get rid of it. From 2015 to 2021, Ramsey was allegedly paid $450,000 per month to promote the company to his audience — totaling over $30 million — in exchange for driving over $70 million of total revenue to Timeshare Exit Team.
Timeshare Exit Team charged anywhere from $4,000 up to $72,000 for its services and promised customers a 100% refund if they were not relieved of their timeshare obligations. However, the company didn’t advertise to customers that its definition of “relief” included the the possibility of customers negotiating themselves out of the timeshares, the timeshare company foreclosing on customers and ruining their credit for 7 years, and a variety of pseudo-legal processes that allegedly deceived thousands of customers into thinking they were legally released from their obligations when they were not. Some customers tried visiting the Timeshare Exit Team office near Seattle only to be told that no one had been in for months. Many of those customers were long-time Ramsey listeners who felt betrayed that he had misled them by making false statements about the trustworthy “legal specialists” employed by Timeshare Exit Team.

Throughout his promotions, Ramsey assured his listeners that he had vetted the Timeshare Exit Team, and that he was confident they could get anyone out of their timeshare commitment. And Ramsey continued to promote the company after several warning signs that something was wrong. Starting in 2016, Ramsey began allegedly receiving what would eventually add up to thousands of letters from listeners complaining about their experiences with the Timeshare Exit Team.
Ramsey continued to promote them.
In 2018, the Better Business Bureau (which in my opinion is also something of a scam) issued an alert after receiving more than 300 complaints about the Timeshare Exit Team, which held a “C-” rating.
Ramsey continued to promote them.
In May 2019, a Florida district court found the Timeshare Exit Team’s practices unfair and deceptive as a matter of law.
Ramsey continued to promote them.
In February 2020, the Washington State Attorney General filed a lawsuit against the Timeshare Exit Team alleging violations of the Consumer Protection Act and listing out nearly 5 pages of unfair and deceptive trade practices. Here are just eight of the allegations:
- Displaying review summaries on timeshareexitteam.com which omitted 1- and 2-star reviews.
- Misrepresenting that the Timeshare Exit Team will help people get out of their timeshare obligations by forcing resorts to cancel or annul timeshare contracts, when in reality, the company often just led customers into foreclosure which ruined their credit for 7 years.
- Interpreting foreclosure as a successful timeshare exit without disclosing that interpretation to customers at the point of sale of Timeshare Exit Team’s services.
- Offering a 100% money-back guarantee, but not disclosing the full terms of the guarantee and not honoring the guarantee, despite many unsatisfied customers requesting a refund.
- Misrepresenting that customers’ timeshare obligations had been terminated when they had not been.
- Misrepresenting to customers that progress had been made towards a timeshare exit, when in fact no services had been rendered to move the progress along.
- Misleading customers into believing there would not be negative financial consequences from the efforts of the Timeshare Exit Team.
- Giving customers a false impression that the Timeshare Exit Team had a 100% success rate when in fact the company’s own records indicated roughly half of its customers had no exit and the majority of the other half had foreclosures and other “bad” exits with unanticipated negative consequences.
Interestingly, the Washington AG’s lawsuit also contained an entire separate section accusing the owners of Timeshare Exit Team of also running a debt counseling business that violated the Credit Services Organization Act, operated without the legally required surety bond, and engaged in deceptive or fraudulent practices.
Unbothered, Ramsey continued promoting Timeshare Exit Team for more than a year after the Washington AG’s lawsuit was filed. But eventually, the AG’s lawsuit was settled, and Timeshare Exit Team was forced to rescind certain statements, cease using certain advertisements, cease using certain financially damaging “exit methods”, disclose many of its business practices to consumers, more readily provide refunds, and pay $2.61 million in customer restitution. A few months later, they were out of business.
All of this from a company that Dave Ramsey told his audience that he had been skeptical of at first but had then vetted and found trustworthy.
Ramsey promoted the Timeshare Exit Team even as many of his listeners filed lawsuits against the company and fourteen separate arbitrators issued awards to the company’s customers because of the company’s misconduct. In fact, let’s just take a moment and listen to Ramsey’s own words of endorsement:
Ramsey only stopped promoting the company in March 2021 when the Timeshare Exit Team and its associated marketing company, Happy Hour Media, stopped paying him.
The lawsuit against Ramsey alleges that Ramsey made statements he knew, or should have known, were false, and it’s hard to see how Ramsey can refute that. He endorsed the team as “legal specialists” when in reality it was run by non-lawyers who used to sell rain gutter systems and now outsource what little work they actually do to third party lawyers who mostly send boilerplate demand letters and then declare success, even when the demand letter has no legal effect.
However, instead of apologizing, Ramsey recorded a 10-minute radio segment in which accused journalists and the Washington State Attorney General of being bought by the timeshare companies. I guess he forgot about the 14 separate arbitrators who awarded his own listeners civil damages for Timeshare Exit Team’s misconduct. Those were not really publicized which means there would be little incentive for timeshare companies to find and pay off all those arbitrators, not to mention that it’s unlikely every arbitrator could be bought, even if some could be. But to Dave, everything is a conspiracy coordinated by the timeshare industry.

“[The CEO of Hilton] teamed up with Wyndham, and he teamed up with Bluegreen…and Marriott and whoever else they could get, Westgate, whoever else they could get on the list, and they decided to go after these lawyers and different companies that were running people out of timeshares… They’ve got bad stories written about people, including they’re going after me now. They’ve got the Attorney General in the state of Washington to try to prove that there was something false going on when there wasn’t… I wonder how much he was paid…And [you journalists at Insider who asked me why I promoted Timeshare Exit Team] how much were you paid?”
Dave Ramsey
Firstly, I want to point out that Dave was talking about going after lawyers, but Brandon Reed and Trevor Hein, the founders and primary operators of Timeshare Exit Team, were not actually lawyers, and the company was not a law firm.
Secondly, I want to point out that Dave is assuming the world is all about good versus evil, and since timeshare companies are evil, Timeshare Exit Team must be good. But reality doesn’t work that way. Once a person has been scammed once, they’re identified as an easy mark. In fact, there is an entire industry of “recovery scams” using what the Federal Trade Commission calls “sucker lists” where scammers offer to help the victim of a previous scam recover their money, in exchange for an upfront payment for services that will never be rendered. For example:
- From January 2021 to March 2022, the FTC reported that over 46,000 people lost a total of more than $1 billion to cryptocurrency scammers. A subset of those people were subsequently retargeted by scammers who promised to help them recover the funds in exchange for an upfront fee, but then those scammers vanished, leaving the victims even worse off than they were after the original scam.
- Victims of vehicle theft are another group often retargeted by scammers. Someone promises to help the victim recover their vehicle in exchange for an upfront fee to cover the cost of the tow truck they’ll need to pick up the vehicle when they find it. Of course, the scammer never rents a tow truck. They just take the money and disappear.
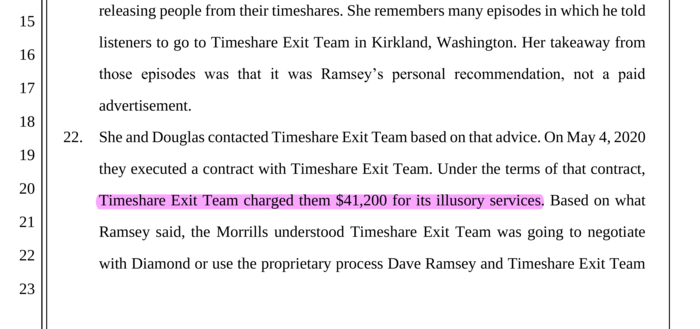
One couple that listened to Dave Ramsey paid over $41,000 to Timeshare Exit Company and got no help in actually getting out of their Timeshare! If Dave doesn’t think that is as much of a scam as timeshares themselves, then he’s either delusional or a liar.

Also, during Dave’s rant, he said that timeshare companies had “poked the wrong bear”, that Dave was sitting in a “$300 million building that’s bought and paid for”, that Dave was “neck deep in cash”, and that he was coming for the timeshare companies. So why didn’t Dave buy Timeshare Exit Team?
Dave claimed to be sitting in a castle of cash that he was going to put to work fighting the timeshare companies, so if he really believed that Timeshare Exit Team was doing a good job helping people, the best way he could have put that cash to work would be to acquire the company. He probably could’ve bought the company nearly for free since it was about to go bankrupt anyway. His cash reserve could’ve allowed the company to make it through the lawsuits and restructure to become profitable again. Why didn’t he seize this opportunity?
Or alternatively, why hasn’t Dave just set up a new timeshare exit service company himself? One of the main methods used by Timeshare Exit Team was just letting people be foreclosed on by the timeshare companies. He could form “Ramsey Timeshare Exits” and charge people $4,000 to $40,000 to let them be foreclosed on, just like Timeshare Exit Team did. There’s something disingenuous about Ramsey ranting that he is sitting on hundreds of millions of dollars and going to crusade against the Timeshare companies for ruining Timeshare Exit Team’s business, but then doing nothing to ensure the survival of Timeshare Exit Team or any other timeshare exit solution. Cue Dave Ramsey saying:
“When something feels slimy, you know? Cause it’s slimy!”
So, did Dave Ramsey make tens of millions of dollars sending tens of thousands of people to pay thousands of dollars each to a company that turned around and paid $500 each to a morally questionable lawyer that sent those unsuspecting people into foreclosure and 7 years of ruined credit? Almost certainly yes.
Were Dave’s actions unethical?
“We do not endorse things on this show unless we believe in them. I don’t put my name or my voice on something merely for money.”
Dave Ramsey, speaking about the Timeshare Exit Team controversy
I’m actually willing to give Dave the benefit of the doubt on this–my first guess would be that he is simply gullible.
According to many of the lawsuits involving Timeshare Exit Team, thousands of customers were tricked into thinking they had been released from their timeshare obligations, and they sometimes went on for years without making payments before they found out the truth. No doubt some percentage of these people reached out to Dave to thank him for recommending Timeshare Exit Team after they thought they were free. Dave would have looked at those hundreds of messages and concluded that Timeshare Exit Team was helping people. So when new a few customers and even the Washington AG started suing Timeshare Exit Team, it would have been easy for Dave to believe that those things did not reflect reality.
However, if Dave had bothered to read the details of the various lawsuits and arbitration cases, he would have realized that many of the people who had originally been happy with Timeshare Exit Team eventually became very unhappy when they realized they had been sent into a foreclosure they didn’t ask for or were actually still responsible for the timeshare that the Exit Team told them they had been “exited” from. He would have discovered the evidence that Timeshare Exit Team hid 1- and 2-star reviews from their websites–a serious sign of deception. And he would have discovered that the operators of Timeshare Exit Team also owned a debt relief company that operated without the legally required surety bond–a sign of either incompetence or disregard for the law. Neither is what you want when you pay $42,000 to a company of supposed “legal specialists”.
If you enjoyed this article, subscribe to my free newsletter for more business deep dives.
References
[2] Class action lawsuit against Dave Ramsey (Initial Complaint)
[3] Class action lawsuit against Dave Ramsey (Docket)
[4] Video clip: Dave Ramsey promoting Timeshare Exit Team
[5] Westgate Resorts, Ltd. v. Reed Hein & Assocs., United States District Court, Middle District of Florida. Feb 2020.
[6] Orange Lake Country Club, Inc. v. Reed Hein & Assocs., United States District Court, Middle District of Florida. Jan 2019.
[7] Florida District Judge Rules Westgate Unable to Prove Claims Against Timeshare Exit Team. Feb 2020.
[8] Addressing the Challenge of Chronic Fraud Victimization. FINRA and AARP.
[9] Refund and Recovery Scams. FTC.
Appendix A: Plaintiffs in the Dave Ramsey Case

The following are the plaintiffs in the class action suit against Dave Ramsey, along with the amount they each paid to Timeshare Exit Team.
- Anna Patrick — Paid $8,570
- Douglas and Roseanne Morrill — Paid $41,200
- Leisa Garrett — Paid $4797
- Robert and Samantha Nixon — Paid $7,839
- David and Rosemarie Bottonfield — Paid $8,795
- Tasha Ryan — Paid over $5,000
- Rogelio Vargas — Paid $5,495
- Marilyn Dewey — Paid $7,355
- Peter and Rachael Rollins — Paid $6,145
- Katrina Benny — Paid $4,497
- Sara Erickson — Paid $5,102
- Greg Larson — Paid $4,797
- James King — Paid $4,797
Appendix B: Related Cases
State of Washington v. Reed Hein et al.
Case No: 20-2-03141-1 SEA
The Attorney General for Washington State, on behalf of the Washington Consumer Protection Division, filed a lawsuit against Reed Hein and others in early 2020. The AG makes several allegations, including that the majority of Reed Hein’s customers (1) did not receive the promised exit, even after years of Reed Hein’s claimed work towards it, (2) received an “exit” that causes the customer unanticipated negative financial or other consequences, or (3) received an exit the customer could have obtained for themselves, without paying thousands of dollars to the defendants.
Documents:
- Initial complaint (Feb 2020)
Orange Lake Country Club v. Reed Hein & Associates (Settled)
Case No: 6:17-cv-01542
This Florida district court case was filed in August 2017 and settled in January 2020.
Wyndham Vacation Ownership et al. v. Reed Hein et al.
Case No: 6:18-cv-02171-GAP-DCI
This case was filed by several timeshare companies against Reed Hein, the key operators of Reed Hein, as well as Reed Hein partners such as Happy Hour Media Group and Mitchell Sussman.
The plaintiffs make several accusations:
- Defendants engaged in false advertising in violation of the Lanham Act.
- Defendants violated Florida’s Deceptive and Unfair Trade Practices Act (FDUTPA).
- Defendants engaged in a civil conspiracy to perform the above violations.
Wyndham Vacation Ownership v. Reed Hein & Associates
Case No (DC): 1:19-mc-00121
Case No (Florida): 6:19-MC-00044
This DC district court case was filed in July 2019 but then transferred to the Middle District of Florida in August 2019.
Diamond Resorts v. Reed Hein & Associates (Settled)
Case No: 2:17-cv-03007-APG-VCF
The plaintiffs make several accusations:
- Intentional interference with prospective economic advantage.
- Direct and contributory false advertising in violation of the Lanham Act.
- Violations of the Nevada Deceptive Trade Practices Act (NDTPA).
- Civil conspiracy.
A judge dismissed the NDTPA claim for lacking the requisite specificity. Eventually, in February 2022, the case was settled.
Documents:
- Order granting in part and denying in part TET and Happy Hour’s Motions to Dismiss (Nov 2019)
- Settlement notice (Feb 2022)
Westgate Resorts v. Reed Hein & Associates
Case No: 6:18-cv-1088-Orl-31DCI
Westgate Resorts, a major timeshare development company, sued Reed Hein, alleging … details?
Appendix C: Additional Facts
Reed Hein & Associates (doing business as “Timeshare Exit Team”) was founded in 2012, based in Bellevue, Washington.
Over the next 10 years, the company allegedly convinced thousands of consumers to pay more than $200 million in exchange for a “hollow promise” to terminate those consumers’ timeshare contracts.
Reed Hein was affiliated with (and possibly owned) a marketing company named Happy Hour Media Group (based in Kirkland, Washington) which it used to pay Dave Ramsey.
Dave Ramsey wholly owns the company Lampo Group which received some or all of the money for promoting Timeshare Exit Team.
Reed Hein allegedly charged customers between $4,000 and up to $72,000 for its services and promised customers a 100% refund if they were not relieved of their timeshare obligations. However, it defined such “relief” so broadly as to include the possibility of the timeshare company foreclosing on customers, the customers negotiating themselves out of timeshares, and a variety of pseudo-legal processes designed to deceive customers into thinking they were legally released from their obligations when they were not.
Over the period from 2015 until 2021, when Dave Ramsey was promoting Timeshare Exit Team, the company went from less than $1 million in annual revenue to over $40 million in annual revenue.