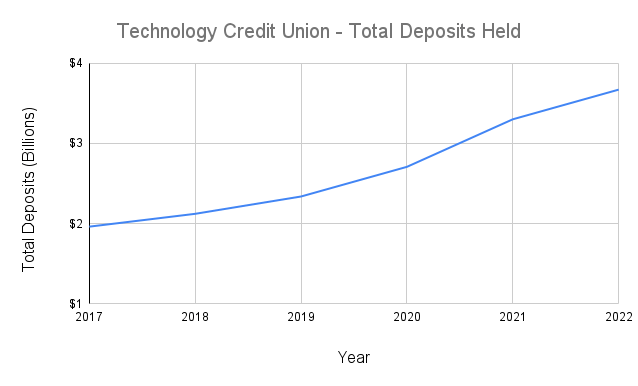
“Even Tech CU (a Silicon Valley credit union catering to tech workers) only grew its deposits by 35.6% from the beginning of 2020 to the end of 2021. That’s almost 6 times less than the deposit growth of Silicon Valley Bank during the same time period.”
Silicon Valley Bank (SVB) failed because (1) it received a HUGE amount of deposits during the pandemic, (2) it couldn’t lend out the money fast enough so it bought lots of long-duration, low-yield investments, (3) it didn’t hedge interest rate risk on those investments, and (4) The Fed raised interest rates significantly after the pandemic, causing the low-yield investments to lose value at the same time as deposits decreased due to a slowly economy.
Most credit unions also received a surge of deposits due to pandemic government stimulus, but the magnitude of their deposit growth was SIGNIFICANTLY less than the deposit growth of SVB.
The chart below shows the total deposits at all federally insured credit unions.
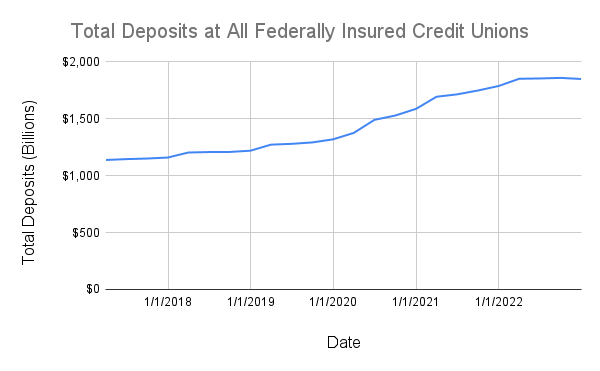
From the beginning of 2020 through the end of 2021, total deposits at federally insured credit unions grew 35.5%. This is roughly the same percentage as overall deposit growth at U.S. commercial banks during that time (36.1%, charted below).
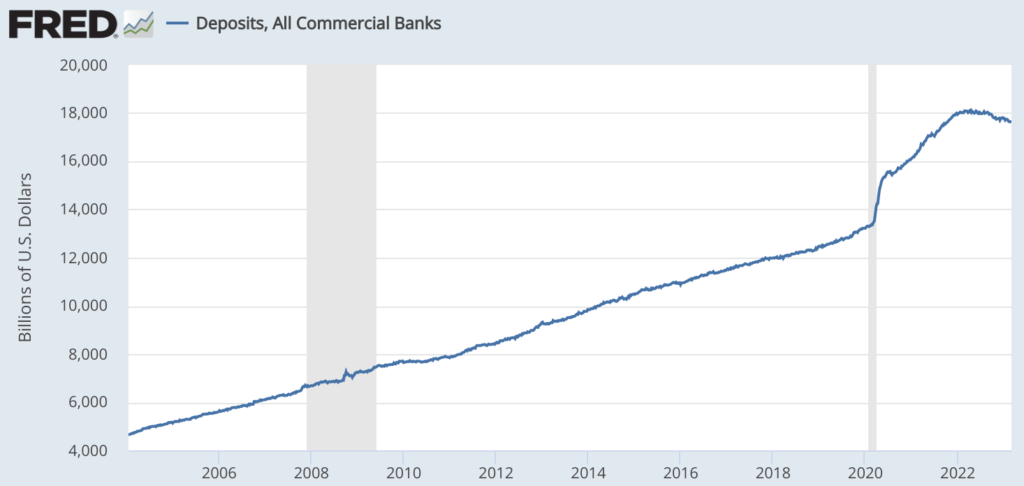
By comparing those two charts, it would seem that the deposit pressure on banks and credit unions is about the same. However, the banking system has more high-risk outliers than the credit union system has. The most stark example of this is SVB itself.
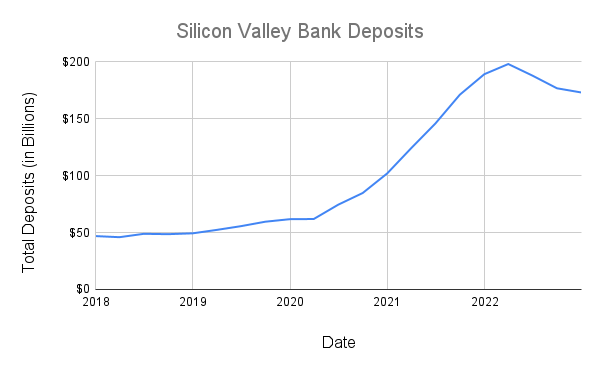
From the start of 2020 to the start of 2022, SVB’s deposits grew 206% (versus the average bank which grew deposits by only 36.1%!). First Republic Bank (NYSE: FRC) grew average deposits by 64.4% from 2020 to 2022. Western Alliance Bank grew deposits by 109%. Each of these banks focused on businesses and/or business owners rather than ordinary consumers, and the booming tech and real estate markets during the pandemic meant these banks experienced deposit growth much more than the average bank.
In contrast, credit unions tend to serve employees of certain organizations as their customers. Because cash flow for an employee tends to be more stable than cash flow for a business owner or business entity, credit unions have somewhat less volatility in deposits than banks. Even Tech CU (a Silicon Valley credit union catering to tech workers) only grew its deposits by 35.6% from the beginning of 2020 to the end of 2021. That’s only 0.1% higher growth than the average federally insured credit union and almost 6 times less than the deposit growth of Silicon Valley Bank during the same time period.
Other credit unions that you might suspect of being overexposed to tech or business include:
- First Tech Federal Credit Union (19.2% growth in deposits over the 2-year span of 2020-2021)
- Patelco Credit Union (28.8% growth in deposits)
- Digital Federal Credit Union (11.5% growth in deposits)
- Seattle Credit Union (28.0% growth in deposits over the 3-year span of 2019-2021)
How can the most tech-related credit unions have grown deposits by smaller percentages than the overall credit union system?
The answer is that much of the growth in overall credit union deposits was due to an increase in the number of Americans who use credit unions (about 15 million additional people started using credit unions between 2019 and 2021), and those were concentrated in a few major credit unions. In contrast, only about 1 million additional Americans signed up for a bank account during that period.
What does all of this mean? Are credit unions at risk of collapse?
Most credit unions (even credit unions with a concentration of customers in the tech industry) have not experienced anywhere near the level of deposit growth that some banks have during the pandemic years. As a result, they were not pressured into buying tons of investments yielding less than 2% like SVB or similar banks were. They still might have bought such investments anyway, but hopefully not as many given that they were under less pressure. Unfortunately, it’s hard to verify that because most credit unions don’t publish audited (or even very detailed) financial statements.
NOTE: Even if credit unions DID buy a bunch of investments yielding less than 2% back when interest rates were low, it’s still unlikely that they would suffer the same fate as SVB. For one thing, banks almost always hedge their interest rate risk (but SVB did not). Small credit unions might not hedge as much as they should, but large credit unions probably do, and interest rate hedging could have prevented SVB’s collapse.
NOTE 2: A run on a bank (or credit union) can destroy even a strong bank (or credit union). That means any credit union can fail if enough people lose confidence in it. Since credit unions are much smaller than the largest banks and since they tend to serve individuals rather than businesses, they are unlikely to be deemed “systemic risks” by any government agency. That means if a credit union does fail, there is very little chance of getting back all of your money if you have more than $250,000 deposited.
Are credit unions safer than banks during recessions?
During the Great Recession, credit unions were statistically less likely to fail than banks. One reason why is that credit unions are non-profits where the customers are also the owners. That reduces the incentive for owners to take risky bets with deposit money.
NCUA vs FDIC: What’s the difference?
FDIC and NCUA are both federal government agencies which provide insurance to depository institutions. Both agencies offer essentially the same insurance up to $250,000 per account. The only significant difference is that the FDIC provides insurance to banks while the NCUA provides insurance to credit unions.
How big is the credit union industry?
As of December 31, 2022, there were 4,760 federally insured credit unions which collectively held $2.17 trillion of total assets (up 5.2% from Q4 2021 but down 2.3% from Q1 2022).
However, only 421 of those held at least $1 billion of assets, and those 421 credit unions collectively held $1.6 trillion of total assets (75% of all assets held by federally insured credit unions).
The total number of credit union members/customers as of the end of 2022 was 135.3 million.
How profitable are credit unions?
The return on average assets for federally insured credit unions in 2022 was 0.89%, down from 1.07% in 2021. The median return on average assets across all federally insured credit unions was 0.51%, up from 0.50% in 2021.
References
[1] National Credit Union Administration (NCUA) financial data for Q4 2022
[2] Tech CU 2021 Annual Report
[3] FRED – Deposits (All Commercial Banks)
[4] 2021 FDIC National Survey of Unbanked and Underbanked Households – Executive Summary
[5] World Council of Credit Unions
[6] National Association of Federally-Insured Credit Unions (U.S. trade organization)