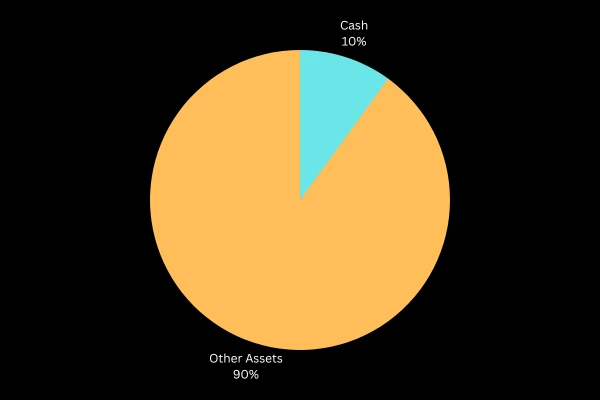
I sampled a variety of companies to get an idea of how much cash typical businesses hold on their balance sheets. The data is in the table below.
| Company | Industry | Cash & Cash Equivalents as % of FY2022 Assets |
| Apple | Tech | 17.5% |
| Coca Cola | Consumer Goods | 10.3% |
| IBM | Tech | 4.4% |
| Crocs | Consumer Goods | 4.3% |
| Alphabet | Tech | 6.0% |
| Acorda Therapeutics | Biotech | 9.5% |
| Optical Cable Corporation | Manufacturing | 0.5% |
| MIND Technology | Tech | 12.2% |
| Intrusion | Tech | 32.5% |
| BlackLine | Tech | 10.3% |
| Five Below | Retail | 10.0% |
| Shake Shack | Restaurant | 15.4% |
| Kronos Worldwide | Chemical Production | 32.3% |
| Carlisle Companies | Manufacturing Conglomerate | 5.5% |
| Installed Building Products | Installation Contractor | 12.9% |
This is important data to know if you want to create an opportunity zone business (because opportunity zone businesses need to comply with the 5% rule).