The U.S. Department of Housing and Urban Development (HUD), the Census Bureau, the Federal Reserve, the National Association of Realtors (NAR), Redfin, and various other organizations publish extensive housing market data on a regular basis.
However, they frequently use different definitions for the variables they report, which can seriously mislead you if you’re not paying attention. For example, if you’re looking at an article that quotes the median home price last month, that might be referring to:
- The median sale price of existing single family homes sold last month
- The median sale price of new construction single family homes sold last month
- The median sale price of ALL (existing & new construction) single family homes sold last month
- The median listing price of single family homes currently on the market
- Any of the previously mentioned measures, but for condos instead of single family homes
- Any of the previous measures for condos and single family homes combined
- Any of the previous measures for sold properties, but only for properties which were financed (i.e. excluding cash purchases, which account for over 40% of sales in some Florida markets)
- Any of the previous measures for sold properties, but only for properties which were financed using a federally backed mortgage (e.g. an FHA loan)
- Any of the previous measures, but only for properties listed on the MLS (i.e. excluding properties for-sale-by-owner and properties sold by real estate agents who aren’t members of NAR)
- Any of the previous measures, but seasonally adjusted
That’s more than 100 different possible meanings for “median home price last month”, and those differences in definitions can paint very different stories of what’s happening in the housing market.
Example 1
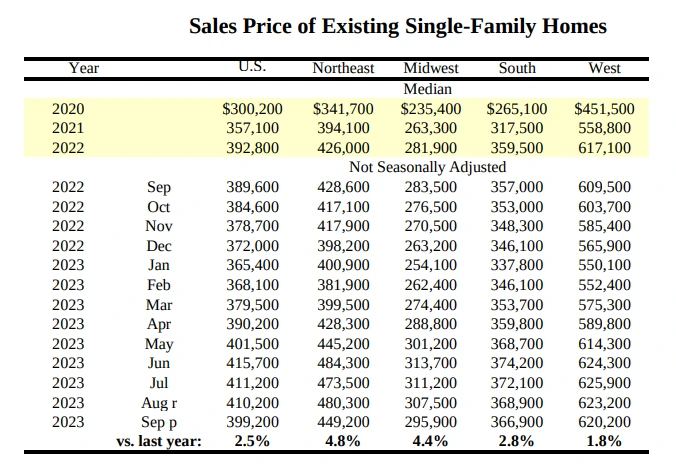
According to NAR, the median home price in the U.S. rose 2.5% from $389,600 in September 2022 to $399,200 in September 2023. The NAR data table is shown below.
Meanwhile, FRED reports the median sales price of houses sold for the U.S. to be DOWN 7.9% from $468,000 in Q3 2022 to $431,000 in Q3 2023.
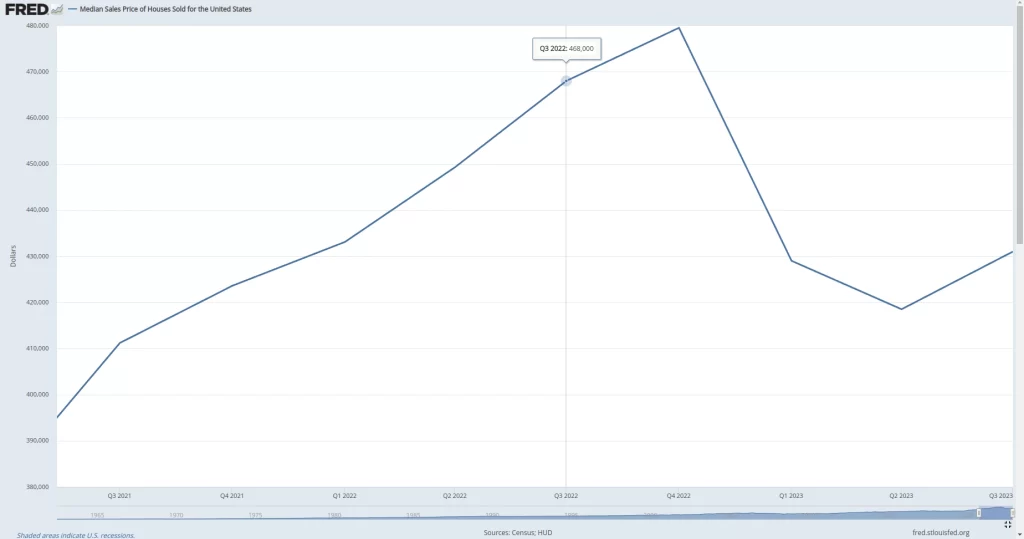
To be clear, NAR says home prices are up 2.5%, but FRED says they are down 7.9%. How is that possible?
The answer is that NAR is measuring the median sale price of EXISTING single family homes while the FRED series I mentioned is (despite the misleading label of “median sales price of houses sold for the United States”) only measuring the median sale price of NEW CONSTRUCTION single family homes.
In general, most single family home sales are EXISTING home sales rather than new construction. For example, in 2022, there were 641,000 new construction single family homes sold and 4.48 million existing single family homes sold. That means in the example above, the NAR data (reporting an increase in home prices nationally) is much more reflective of the overall housing market than the FRED data (which reported a sharp DECREASE in home prices nationally).
The Case-Shiller U.S. home price index also supports that argument since it showed a 2.6% home price increase from August 2022 to August 2023.
Example 2
According to the Miami Realtor Association, the median single family home sale price in Miami-Dade County increased 10.3% from $580,000 in October 2022 to $640,000 in October 2023.
However, that doesn’t mean homes in general became 10% more unaffordable. The Miami Realtor Association ALSO released statistics showing that the median condo sale price in Miami-Dade County only increased 5.9% from $387,000 in October 2022 to $410,000 in October 2023. And in Miami, unlike in the U.S. as a whole, there are more condo sales than single family home sales. That means the true median change in Miami home prices over the last year is closer to 5.9% than to 10.3%.
Summary
When you read a housing market report, always make sure you know which variable you’re looking at so that you aren’t misled.
Don’t look at condos as reflective of the overall U.S. housing market, but DO look at them as reflective of the overall Miami market. Don’t confuse new home price trends with existing home price trends. Don’t confuse trends in listing prices with trends in “sold home” prices. Etc. Now go forth, analyze the data, and make good investments.