A ChatGPT plugin is essentially an app that people can use within the normal ChatGPT interface. In particular, a ChatGPT plugin is an API with a manifest.json file that is registered with OpenAI. Plugins can allow ChatGPT to access up-to-date or personal information as well as use third-party software services. Here are some examples of things plugins could be created to do:
Access the current top 5 stories on CNN’s website
Get a list of all events on a ChatGPT user’s Google Calendar for today
Add shampoo to your Amazon cart
Get the current stock price for Microsoft
Get a list of the 5 cheapest “Entire place” Airbnb listings in Miami
Run a web search for a particular topic and return the text of the first informational page returned in the search results
Send an email
Check and summarize any unopened emails in a ChatGPT user’s inbox
Check what time it is
Check the weather in a given city
ChatGPT plugins are currently in alpha testing. OpenAI has created three native plugins:
A web browsing plugin that allows ChatGPT to search the internet in real time
A code interpreter plugin that allows ChatGPT to run python code (including code to generate plots and graphics)
A document repository search plugin that allows ChatGPT to search a private repository of notes/documents
Additionally, several companies have partnered with OpenAI to produce plugins that are currently available to in alpha testing:
Expedia
Instacart
OpenTable
Zapier
Wolfram Alpha
Klarna Shopping
Kayak.com
FiscalNote
Speak.com
Shopify
If you want to build your own plugin, you can build your API now but you’ll have to join OpenAI’s waitlist to register it as a ChatGPT plugin.
NOTE: According to OpenAI rules, any plugin that distributes personal communications (e.g. a plugin to send emails) must indicate in those communications that the content was generated by AI.
What are some ChatGPT plugin business ideas?
A plugin to post Tweets and Twitter threads.
A plugin to publish blog posts on WordPress sites.
A plugin to do image searches on the web.
A plugin that allows ChatGPT to make changes to Google Sheets or Excel spreadsheets.
A plugin that allows ChatGPT to write book chapters in a Google Doc.
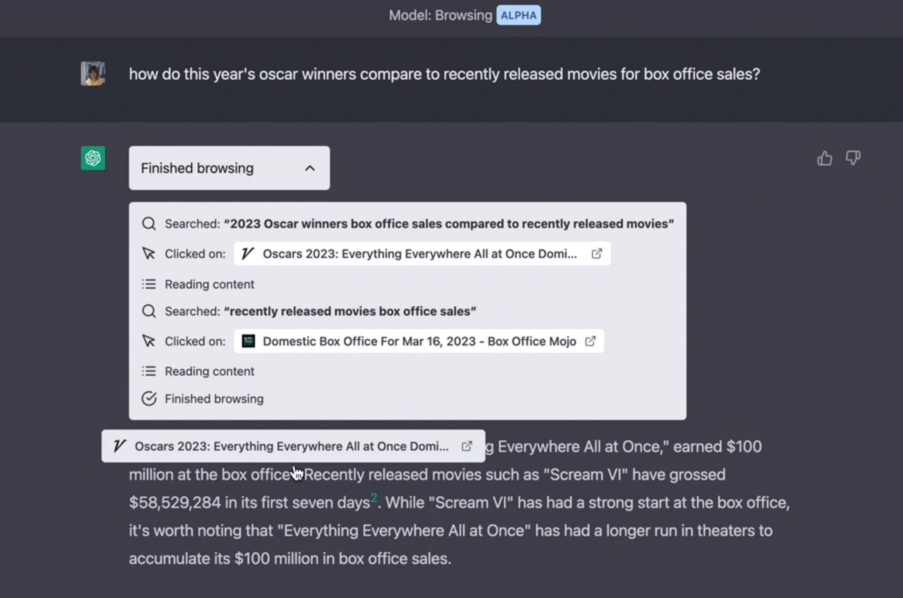
“Imagine if you bought $100,000 of bonds and then the bond market dropped by 20%. If you were a normal, rational person, you would say your portfolio is now worth $80,000. However, if you were a bank, you would say your portfolio is still worth $100,000.”
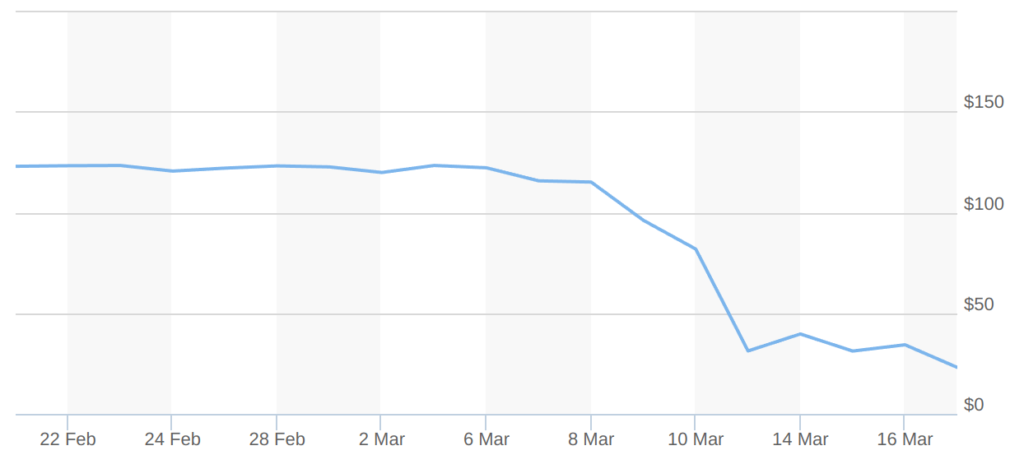
First Republic Bank Stock Price
First Republic Bank had a problem long before its stock dropped over 81% in 2 weeks, and that problem was hidden in plain sight for anyone willing to read through the tedious “notes to consolidated financial statements” in the company’s 2022 annual report.
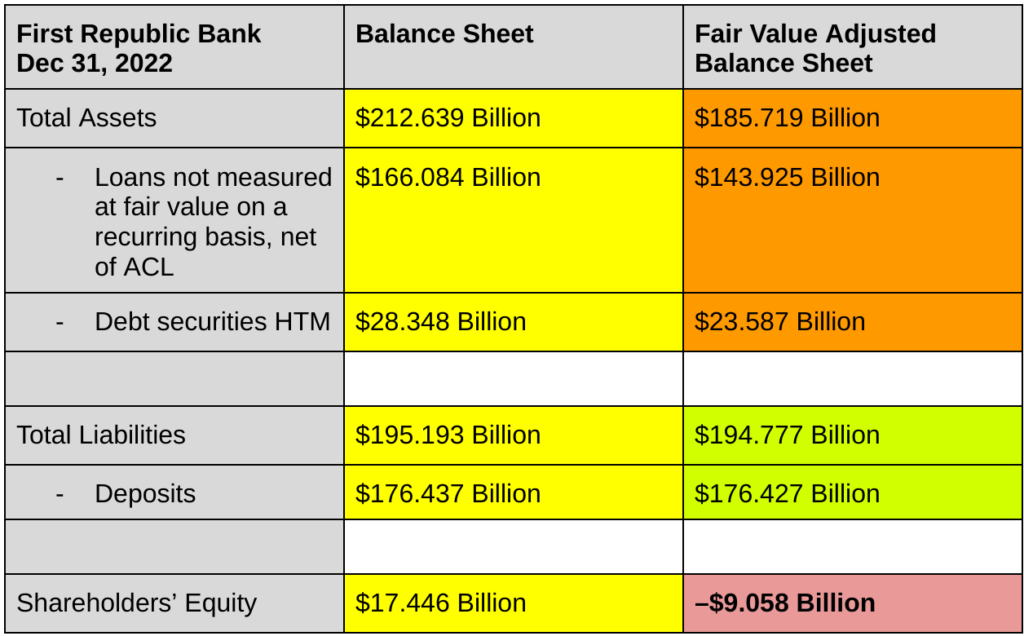
The problem is that the company is more than $9 billion underwater, despite the company’s balance sheet reporting more than $17 billion of shareholders’ equity. The difference between the financial truth (negative $9 billion of equity) and the official financial fiction (positive $17 billion of equity) is $26 billion of accounting lies. The result is that First Republic’s balance sheet overvalues certain assets by tens of billions of dollars but undervalues liabilities only slightly, as shown in the table below.
In this article, I’m going to explain:
The 3 accounting rules (i.e. mathematical lies) that cause the biggest distortions to U.S. bank balance sheets (including the accounting rule that allowed First Republic to overstate its shareholders’ equity by more than $26 billion).
How to un-distort a bank balance sheet to calculate true shareholders’ equity and find investment opportunities that most people miss.
Let’s dive in.
Lie #1: The majority of assets on a bank’s balance sheet are not reported at fair market value
Banks have two main types of assets on their balance sheet:
Loans (e.g. mortgages, credit card debt, business loans, etc)
Debt securities (e.g. Treasury bonds, mortgage-backed securities, and other bundles of loans that get reclassified as securities). For the accounting nerds, this includes debt securities classified as “held-to-maturity” and “available-for-sale” but not securities classified as “trading assets”.
Investments in debt securities and loans (together, the “debt portfolio”) typically constitute 50-95% of a bank’s assets. Larger banks tend to be on the low end of that range (50-75%) while smaller banks tend to be on the high end of that range (75-95%). These numbers are illustrated in the table below which shows the debt portfolio sizes for various publicly traded U.S. banks.
Bank
Total Assets
Debt Portfolio (as % of total assets)
JP Morgan Chase
$3.67 Trillion
48%
Bank of America
$3.05 Trillion
62%
Wells Fargo
$1.88 Trillion
72%
U.S. Bancorp
$675 Billion
80%
PNC
$557 Billion
83%
Truist
$555 Billion
84%
BNY Mellon
$406 Billion
51%
First Republic Bank
$213 Billion
93%
Fifth Third Bancorp
$207 Billion
82%
New York Community Bancorp
$90.1 Billion
87%
Comerica
$85.4 Billion
84%
East West Bank
$64.1 Billion
88%
Wintrust
$52.9 Billion
87%
Pacwest Bancorp
$41.2 Billion
87%
SoFi
$19.0 Billion
75%
Amalgamated Financial
$7.84 Billion
95%
Meridian
$2.06 Billion
93%
Citizens Community Bancorp
$1.82 Billion
91%
Bank of South Carolina
$653 Million
92%
With such a large percentage of a bank’s assets tied up in loans and debt investments, small changes to the value of that debt portfolio can create large changes to (1) the bank’s shareholder equity, (2) the bank’s regulatory compliance with minimum capital requirements, and (3) the bank’s ability to fully repay depositors. That means it’s important to know how banks assign values to their debt portfolio assets, and how much those assigned values might differ from the market values of those same assets.
How U.S. banks value loans and debt securities
There are two main ways that a bank is legally allowed to value loans and debt securities on its balance sheet:
Fair value (aka market value)
Amortized cost (aka the outstanding principal, with minor adjustments)
The fair value of a loan or debt security is defined as the price that would be received to sell that asset on the open market under normal conditions. For debt securities such as Treasury bonds or mortgage-backed securities, there is often an actively traded market which allows banks to determine fair value by simply “marking-to-market”. For loans, there is often not any actively traded market since each bank writes loans with different contractual terms and for a different set of customers. For those loans, banks make estimated guesses of what the loans would sell for based on financial models.
On the other hand, the amortized cost of a loan or debt security has little to do with the asset’s market value. Instead, the amortized cost of a loan (or other debt asset) is just the current outstanding principal of the debt, with minor adjustments for fees on originated loans or premiums/discounts on purchased loans.
Notably, the amortized cost of a loan is usually almost exactly the same as the market value of that loan when the loan is originated. However, as interest rates change over time, the difference between the loan’s fair market value and its amortized cost can grow substantially.
Example 1
On March 20, 2020, Sad Bank buys a 10-year, $100,000 Treasury bond that pays out 0.92% interest annually. We’ll call that bond B20 (because it was bought in 2020). On March 20, 2023, Sad Bank buys a 7-year, $100,000 Treasury bond that pays out 3.55% interest annually. We’ll call that bond B23.
How much is each bond worth on March 20, 2023?
The amortized cost is easy. Treasury bonds are interest-only loans so the outstanding principal (amortized cost) of both B20 and B23 is still $100,000 as of March 20, 2023.
However, if you offered to give me either B20 or B23 for free on March 20, 2023, I would definitely choose B23. The reason is that both bonds will pay out $100k when they expire on March 20, 2030, and both bonds will make exactly the same number of interest payments on the same dates until then, but the total interest paid each year by B20 will only be $920 (0.92% of $100k) whereas the total interest paid each year by B23 will be $3,550 (3.55% of $100k).
That means the fair market value of B23 must be higher than the fair market value for B20 despite both bonds having the same amortized cost.
We know that the fair market value of B23 on March 20, 2023 is $100,000 since we bought it on that date for that price on the open market. So the fair market value of B20 must be less than $100,000.
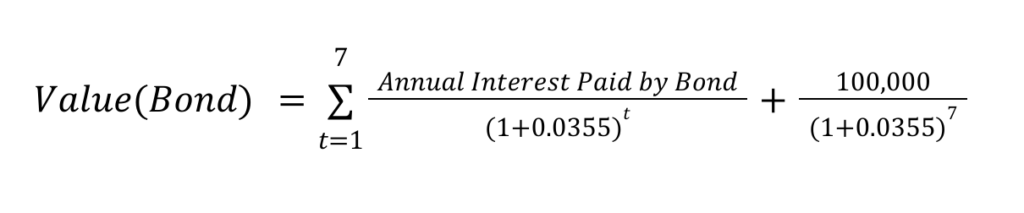
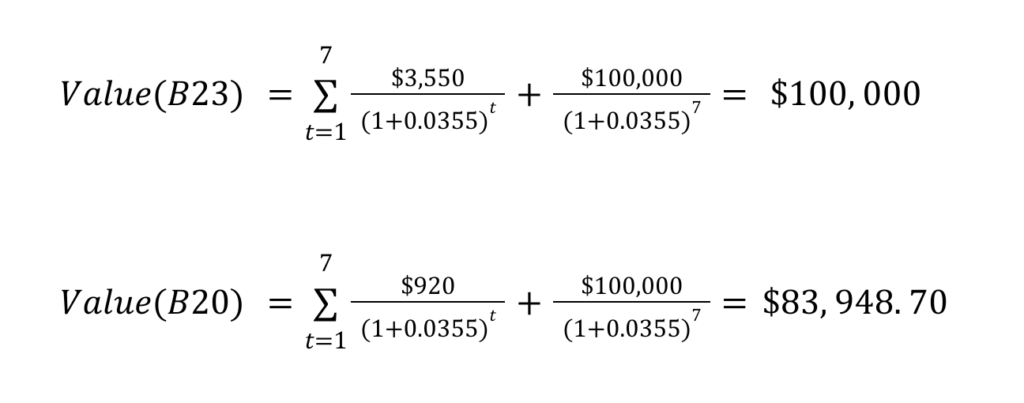
Ordinarily, we wouldn’t be able to know exactly what the fair market value of B20 was without looking at real market data. However, since most banks assume Treasury bonds carry zero-risk, we can use a basic finance formula to estimate a 7-year bond’s value based on discounted cash flows when the prevailing interest rate is 3.55%:
Applying that formula to our bonds, we get:
For B23, we get a fair market value of $100,000 (just as expected). For B20, we get a fair market value of $83,948.70 (over 16% less than the amortized cost).
What percentage of bank balance sheet assets are reported using amortized cost vs fair value?
For most banks, 98-100% of their loan portfolio is reported on the balance sheet at amortized cost, not fair value. However, banks have more optionality when reporting debt securities.
Banks can categorize the debt securities they create or buy into two categories:
Available-for-Sale (AFS)
Held-to-Maturity (HTM)
Debt securities which are classified as AFS are reported on the balance sheet at fair value. However, the very same debt securities, if classified as HTM, can be reported by the bank at amortized cost instead. Some banks classify almost all of their securities as AFS. Other banks classify almost all their securities as HTM. Two identical banks can have VERY different values for total assets and shareholders’ equity just by choosing to classify the majority of their debt securities as HTM or AFS. Be wary of banks with most of their debt securities classified as HTM rather than AFS. They might be hiding big losses behind accounting trickery.
The table below shows the quantity of balance sheet assets which are recorded at amortized cost (including both loans and HTM debt securities) as a percentage of total balance sheet assets, for various publicly traded U.S. banks:
Bank
Total assets
Assets recorded at amortized cost (as % of total assets)
JP Morgan Chase
$3.67 Trillion
41%
Bank of America
$3.05 Trillion
54%
Wells Fargo
$1.88 Trillion
66%
U.S. Bancorp
$675 Billion
67%
PNC
$557 Billion
74%
Truist
$555 Billion
68%
BNY Mellon
$406 Billion
30%
First Republic Bank
$213 Billion
91%
Fifth Third Bancorp
$207 Billion
58%
New York Community Bancorp
$90.1 Billion
76%
Comerica
$85.4 Billion
63%
East West Bank
$64.1 Billion
79%
Wintrust
$52.9 Billion
80%
Pacwest Bancorp
$41.2 Billion
74%
SoFi
$19.0 Billion
3%
Amalgamated Financial
$7.84 Billion
71%
Meridian
$2.06 Billion
85%
Citizens Community Bancorp
$1.82 Billion
82%
Bank of South Carolina
$653 Million
50%
Median
$90.1 Billion
68%
(*SoFi only gained the legal ability to hold loans for investment when it closed on its acquisition of Pacific Bancorp in February 2022. That’s why their percentage of assets held at amortized cost is so low.)
The median bank in our sample had a balance sheet where 68% of assets were reported at amortized cost rather than fair market value. Let that sink in.
Banks are essentially huge margin traders that use customer deposit money to invest in loans and debt securities using 10-20x leverage. Like all margin traders, that makes the equity value of a bank highly sensitive to changes in asset values.
Example 2
Careless Bank has $92 billion of liabilities and $100 billion of assets, of which $68 billion are loans and debt securities reported at amortized cost. That means Careless Bank has:
However, if the fair value of Careless Bank’s portfolio of loans and debt securities is only $65 billion instead of $68 billion, then the actual shareholders’ equity is only:
That means overvaluing Careless Bank’s debt portfolio by only 4.6% ($68 billion instead of $65 billion) resulted in overestimating shareholders’ equity by a whopping 60% ($8 billion instead of $5 billion)!
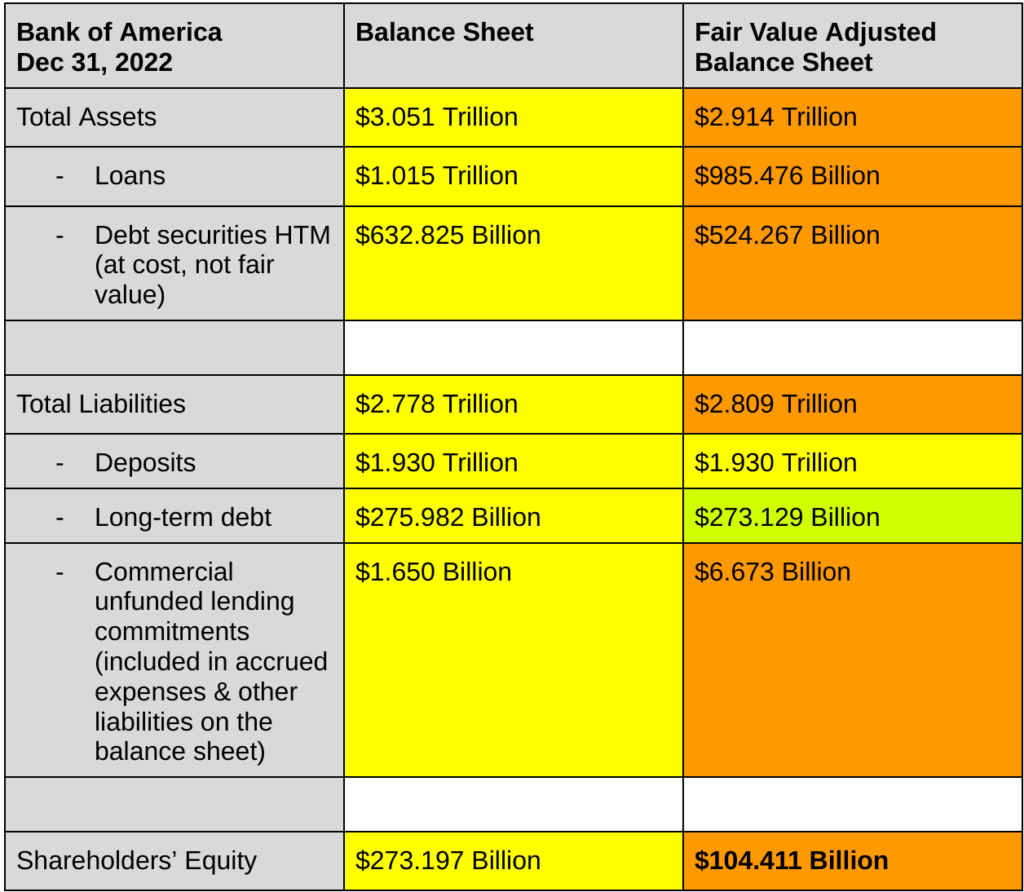
Example 3: Bank of America
Careless Bank was just a hypothetical bank used for example. Now let’s look at the second largest bank in the U.S. The table below shows a summarized version of Bank of America’s official balance sheet on December 31, 2022 as well as a modified version of that balance sheet after adjusting financial assets and liabilities to be reported at fair value.
Example 4: Truist
As you can see, fair value adjustments can MASSIVELY change the apparent solvency of a bank.
Lie #2: Disclosed “fair market values” can be manipulated
“In the latest Treasury auction, a 17-week Treasury bill with a par value of $100 sold for $98.54. Is the fair value of that bill $100 or $98.54?”
Bank balance sheet lie #1 was that banks report the majority of assets on their balance sheet NOT at fair value. However, banks must still disclose the fair value of those assets in the footnotes of their financial statements.
Bank balance sheet lie #2 is that those footnote disclosures of “fair value” still often differ from true “market value”. I’m going to explain why that is and how to account for it when analyzing a bank.
Why disclosed “fair values” are often wrong:
If you own a share of Tesla stock, you can just look at the last transaction on the NASDAQ stock exchange to determine its fair market value. Since half a million dollars of Tesla stock are traded during each minute of a trading day, the last stock trade is a very good indicator what you would be able to sell your own share of Tesla for if you wanted to.
Contrast that with your car. How much could you sell your car for if you had to sell it this week? According to Kelly Blue Book, my car is worth $16,777. According to Edmunds, it’s worth $21,994. Which is the true “fair value” of my car?
The problem is that my car is unique. There are other cars that are the same make and model as my car, but they have different manufacturer packages, different aftermarket upgrades, different numbers of miles on them, and different amounts of wear and tear. They also don’t sell everyday so even if there was a car identical to mine with the same packages, upgrades, miles, and wear and tear that sold 3 months ago, that wouldn’t necessarily be the same price that I could sell my identical car for today. This is the same problem that banks face, except instead of trying to find the fair value of cars, they are trying to find the fair value of loans.
As with cars, no two loans are exactly the same. They differ by the creditworthiness of the borrower, the debt-to-income of the borrower, the terms of the loan contract, the interest rate, the amount borrowed, the loan duration, and the type of collateral (if any) that the borrower has provided to secure the loan. Also as with cars, most loans are not actively traded which means even if there is a similar or identical loan that sold a few months ago, a bank doesn’t know for sure if that is the same price that the same loan would sell for today.
How do banks determine the fair value of loans & other illiquid assets?
Under U.S. generally accepted accounting rules (GAAP), bank loans and other financial assets fall into a three-level hierarchy based on how their fair values are determined:
Level 1 assets. There are actively traded markets for level 1 assets which means fair values are determined by simply looking at the quoted prices from brokers, dealers, or exchanges. Examples of level 1 assets include cash, central bank reserves, and stocks listed on the NASDAQ or NYSE. The fair value of level 1 assets is assessed by simply looking at the market price which is readily available.
Level 2 assets. These assets are not actively traded, but they are either similar to assets which are actively traded or their values are tied (directly or indirectly) to observable market variables. Examples of level 2 assets include consumer loans that are comparable to those packaged into actively traded mortgage-backed securities (MBS). The fair values of level 2 assets are estimated using matrix pricing, Black-Sholes options pricing, or other financial models which are based entirely on observable market variables (e.g. matrix pricing is based on the prices for a set of assets which are similar to the level 2 asset but which are actively traded).
Level 3 assets. These assets are not substantially similar to any assets which are actively traded, nor are their values determined purely on the basis of observable market variables. Examples of level 3 assets include mortgage servicing rights (MSRs), complex derivative contracts, and certain specialized business loans. Fair values of level 3 assets are determined using financial models such as discounted future cash flows or proprietary models that depend significantly on at least one unobservable variable.
NOTE: Technically, GAAP’s fair value hierarchy is a hierarchy of methods for determining the fair value of assets, not of assets themselves. That means one bank may choose to treat a particular loan as a level 2 asset while another bank might treat the same loan as a level 3 asset because they value it using a different method.
The fair value hierarchy is important because it means that not all disclosures of fair market values are equally trustworthy. For example, if we look at Wells Fargo’s 2021 annual report, we see the following categorization of its primary financial assets:
Financial Asset Category
Fair Value
% of Total
Financial assets (before derivative netting)
$1,848.626 Billion
100%
– Level 1 assets
$354.591 Billion
19.2%
– Level 2 assets
$645.774 Billion
34.9%
– Level 3 assets
$848.261 Billion
45.9%
(Source: Wells Fargo 2021 Annual Report, Exhibit 13. Certain financial assets and netting agreements are not included, but they don’t affect the conclusions we can draw from this table.)
If we look at Fifth Third Bank’s 2021 annual report, we see an even higher percentage of financial assets in the level 3 bucket:
Financial Asset Category
Fair Value
% of Total
Financial assets
$196.739 Billion
100%
– Level 1 assets
$38.117 Billion
19.4%
– Level 2 assets
$42.366 Billion
21.5%
– Level 3 assets
$116.256 Billion
59.1%
For most banks, the majority of level 3 assets are loans, and these level 3 loans frequently account for 50% or more of all financial assets. That means even after we adjust a bank’s balance sheet to use fair values instead of amortized costs, roughly half of the balance sheet is valued using financial models that carry “significant uncertainty” and rely on rough estimates of unobservable variables.
Over a century of public market experience has taught us that when company executives have the freedom to make estimates with “significant uncertainty”, their estimates are statistically overoptimistic. That means in reality, we should expect these level 3 assets to be slightly overvalued on average.
There is also another reason to believe that “fair values” for level 3 loans are not necessarily fair. Level 3 loans are often valued using some version of a future cash flow model. However, a smart cash-flow-focused investor only buys investments that have a market price below the present value of future cash flows. Banks are (or should be) smart investors, and they are definitely cash-flow-focused investors. The most realistically possible buyers for a bank that wants to offload loans are other banks. That means if Bank A wants to sell some loans to Bank B, Bank B will probably only agree if the transaction (market) price is less than the present value of future cash flows of those loans. In other words, the future cash flow based valuation of the loans by the banks is almost certainly less than the actual market price of those loans.
How to fix a bank balance sheet filled with level 3 asset values:
To fix a bank balance sheet filled with level 3 loan assets so that it more accurately reflects the market value of assets, you’ll want to deduct a small percentage of the total dollar value of level 3 assets from the balance sheet.
If you think the bank’s executives have high integrity and you want to be optimistic, subtract 0.1% of the fair value of all level 3 assets. On the other hand, if the bank’s leadership seems like a scandal-magnet, and the culture rewards higher risk, you might want to subtract 2% or more of the fair value of all level 3 assets. Even Treasury bonds sometimes sell with more than a 1% discount from the par value, and yet some banks use Treasury bond interest rates (unadjusted for the discrepancy between par value and sale value) as the discount rates in future cash flow valuation models.
By the way, if you want to read more articles like this on a weekly-ish basis, subscribe to my free newsletter (of which this article is an example) where I talk about how to build better businesses and investment portfolios.
Lie #3: Off-balance sheet litigation liabilities
“In 2020, JP Morgan accrued $1.1 billion of litigation expense (equivalent to 4.0% of the bank’s net income applicable to common stockholders that year). None of that expense had been recorded on the balance sheet as a liability the prior year, despite the bank estimating in 2019 that they had up to $1.3 billion of reasonably possible future litigation costs.”
If a company borrows $1 million to acquire more customers, then it must record that $1 million as a liability on its balance sheet. However, if a company reduces its compliance standards in order to move more quickly and acquire more customers, incurring $1 million of legal liability in the process, the company does not have to record that $1 million liability on its balance sheet, despite the liability being just as real as the borrowed money.
The reason for this is that it’s difficult to know whether or not you actually have a litigation liability until a lawsuit is filed, and even then, you don’t know for sure whether you have a litigation liability or what the size of that liability will be until a verdict is reached in the case. And according to GAAP rules, companies don’t have to record contingent liabilities (i.e. liabilities that are dependent upon some future event occurring) on their balance sheet unless two conditions are satisfied:
The contingency is “probable”
The amount of the liability is “reasonably estimable”
Annoyingly, GAAP does not define when an event is “probable”. In fact, GAAP rules allow different companies to use different tests to determine whether or not an event is “probable”. That means one company can choose to define “probable” to mean an event with at least a 75% chance of occurring while another company can choose to define an event as “probable” if it has at least a 65% chance of occurring. And since companies are not required to disclose their criteria for determining when an event is “probable”, it’s impossible to do a precise calculation of expected value for contingent liabilities. However, Deloitte provides some general guidance on how to convert GAAP terminology to numerical probabilities:
“Probable” = “Likely” = at least 70% chance of occurring
“Reasonably possible” = 10-70% chance of occurring
“Remote” = Less than 10% chance of occurring
GAAP says that remote contingent liabilities can be ignored completely, reasonably possible contingent liabilities must be disclosed in the notes of a financial statement but should not be included on the balance sheet, and probable contingent liabilities should be disclosed on the balance sheet. Actually, GAAP only provides those guidelines for contingent liabilities that are “reasonably estimable”. If a contingent liability is probable but can’t reasonably be estimated, it can still be kept off the balance sheet. Cue investor frustration.
If we assume bank executives report contingent liabilities without bias (big assumption), then the numbers provided by Deloitte imply we should expect the average reported contingent liability to have an 85% chance of occurring and the average disclosed-but-not-reported contingent liability to have a 40% chance of occurring.
That means even if we assume the entire amount of accrued (i.e. reported) litigation expense each year by a bank is for contingent liabilities rather than actual concrete liabilities, we should expect the the reported litigation liability to be (on average) understating the actual expected value of all contingencies that become realized litigation liabilities.
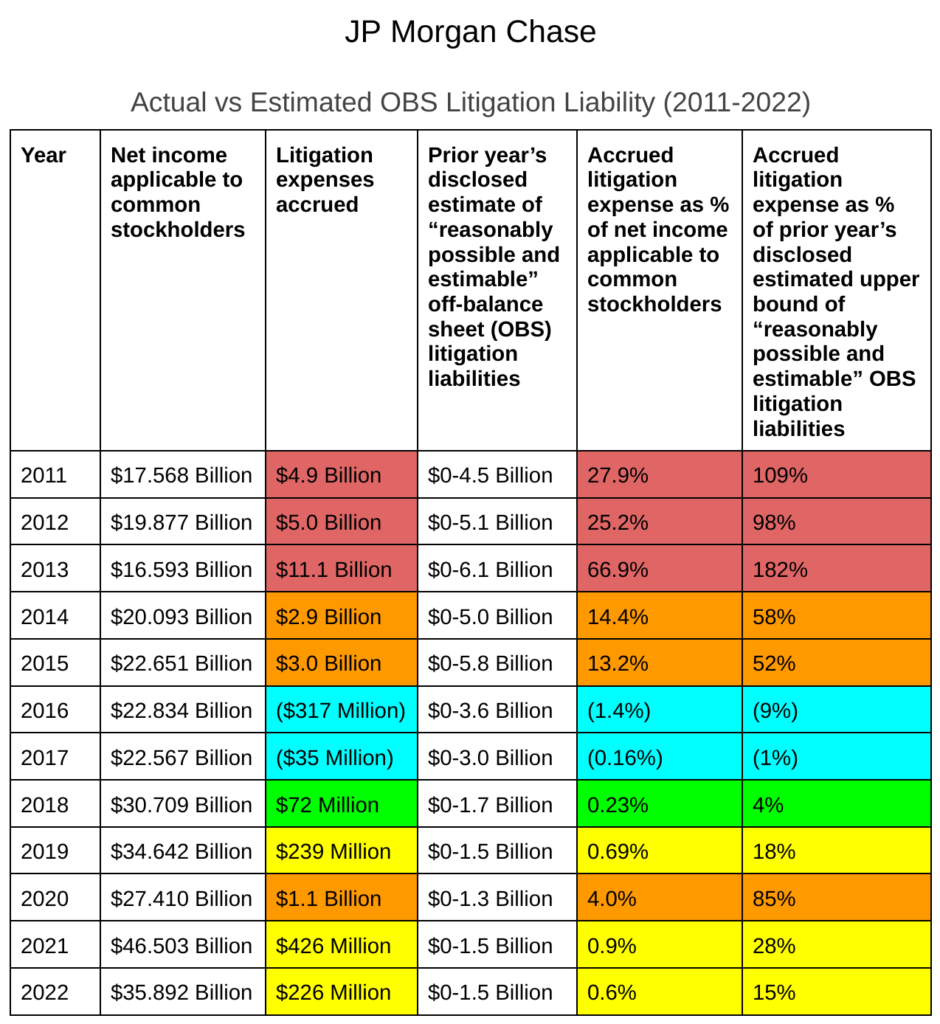
The table below shows the actual amount of litigation expense accrued by JP Morgan in each year from 2011-2022 compared with the bank’s prior year disclosure of off-balance sheet (OBS) “reasonably possible and estimable” contingent litigation liabilities.
The median ratio of this-year’s-accrued-litigation-liability to last-year’s-predicted-OBS-litigation-liability for JP Morgan from 2011-2022 was 56.5%.
In case you think that high cost of litigation is purely due to the Financial Crisis, let me inform you that over the three year period from 2004-2006, JPM accrued $5.752 billion of total litigation expense on $27.324 billion of net income applicable to common stockholders. That means during those years, the litigation expense was over 21% of total net income applicable to common stockholders.
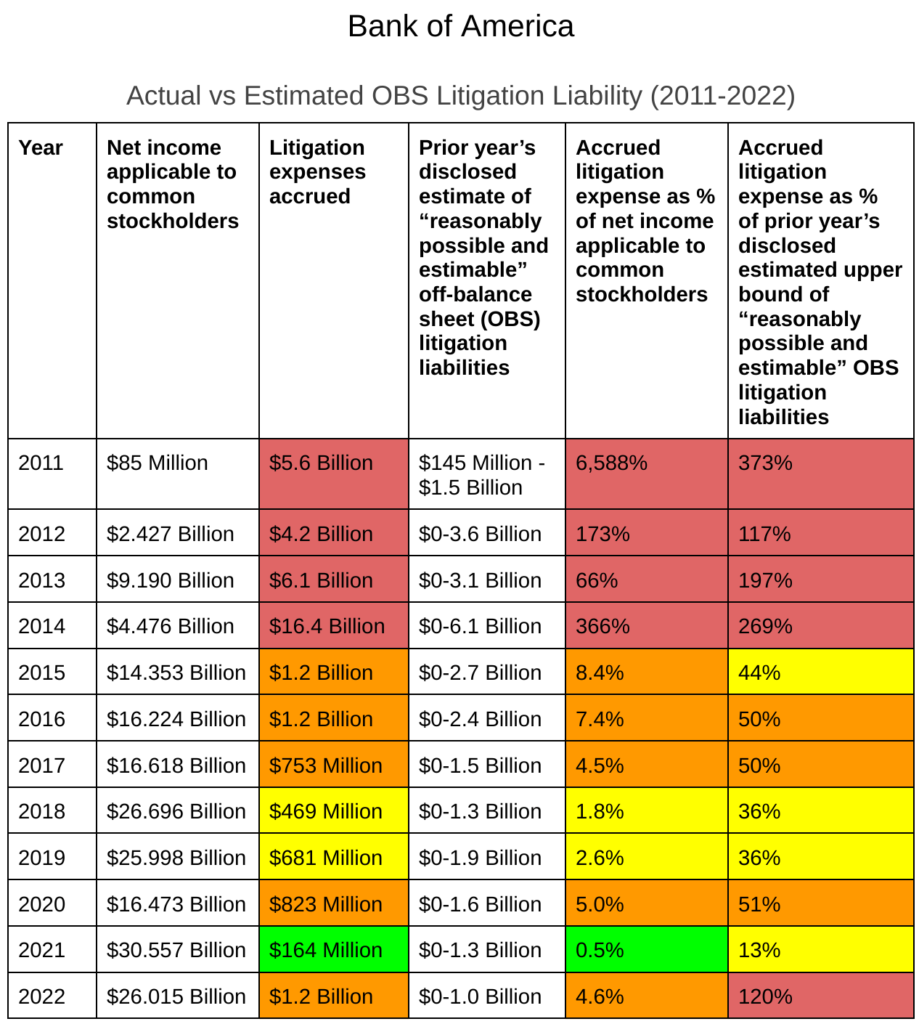
If we look at Bank of America, the litigation liabilities are also extreme:
The median ratio of this-year’s-accrued-litigation-liability to last-year’s-predicted-OBS-litigation-liability is 50%.
How to adjust a bank’s balance sheet to account for off-balance sheet litigation liabilities:
Add a liability to the bank’s balance sheet to account for the expected value of incurred but not accrued contingent litigation liabilities. The size of this new liability could optimistically be set at 10-50% of the amount of disclosed OBS “reasonably possible and estimable” contingent litigation liabilities. For many small banks, this amount will be zero. However, for larger banks and even smaller banks during recessions, this amount will often be nonzero.
How to “Correct” a Bank Balance Sheet Step-by-Step
Step 1: Identify the loans, HTM securities, and other financial assets on the balance sheet that are recorded at amortized cost rather than fair value. Locate the fair value disclosures of those assets in the financial statement notes. Replace the amortized cost values of those assets with the fair values of those assets on the balance sheet.
Step 2: Repeat step 1 but for liabilities instead of assets. The majority of liabilities held by banks are recorded at fair value already, so this will produce a much smaller adjustment than step 1.
Step 3: If you think the bank’s executives and work culture have high integrity and you want to be optimistic, subtract 0.1% of the fair value of all level 3 assets. On the other hand, if the bank’s leadership seems like a scandal-magnet and the culture rewards higher risk, you might want to subtract 2% or more of the fair value of all level 3 assets. Even Treasury bonds sometimes sell with more than a 1% discount from the par value, and yet some banks use Treasury bond interest rates (unadjusted for the discrepancy between par value and sale value) as the discount rates in future cash flow valuation models.
Technically, liabilities can also be assigned fair values through level 3 methods (although typically the amount of level 3 liabilities is far smaller than the amount of level 3 assets on a balance sheet). If you want to be conservative, only make the adjustment described above to the “net” quantity of level 3 assets obtained by first subtracting off the total quantity of level 3 liabilities. If you are more skeptical and believe as I do that bank managers are often (consciously or subconsciously) biased so that they slightly overvalue assets but not liabilities, then just don’t make any adjustments for level 3 liabilities.
Step 4: Add a liability to the bank’s balance sheet to account for the expected value of incurred but not accrued contingent litigation liabilities. The size of this new liability could optimistically be set at 10-50% of the amount of disclosed OBS “reasonably possible and estimable” contingent litigation liabilities. For many small banks, this amount will be zero. However, for larger banks and even smaller banks during recessions, this amount is often nonzero.
NOTE: You can take your step 4 analysis a bit farther by looking through the disclosures of the details of the OBS reasonably possible litigation liabilities and guessing what percentage of those liabilities would likely be covered by insurance if they were realized.
Appendix A: Other off-balance sheet liabilities
“Reasonably possible” litigation liabilities are not the only type of activities hiding off balance sheet. A more comprehensive list of types of fully or partially off-balance sheet activities that banks sometimes engage in include:
Loan commitments
Letters of credit (LOC)
Travelers LOC
LOC sold for cash
Commercial LOC
Standby LOC
Revolving underwriting facilities
minority interests in Variable Interest Entity (VIE)
Due to lobbying efforts by banks, the FASB rules for VIEs were relaxed [post financial crisis], which enabled banks to continue pouring debt in off-balance-sheet entities.
When a company owns a majority interest in a VIE, the holdings must be disclosed in the consolidated balance sheet of the company. The consolidation is not mandatory if the company is not the primary beneficiary of the VIE though.
Pending lawsuits
Liabilities from pending lawsuits are only recorded on the balance sheet when they are “reasonably estimable” and “more than likely to be incurred”, both of which are subjective qualifiers that are applied inconsistently across the banking industry.
Indemnifying executives of the company against certain types of lawsuits
Indemnifying companies that partner with the bank (e.g. VISA) from certain types of lawsuits
Indemnifying foreign investors in certain securities issued by a bank against changes in U.S. tax law that could negatively affect those investors
Indemnifying an acquirer of a bank subsidiary against certain types of lawsuits or losses related to the prior operations of that subsidiary
Membership in certain securities and derivatives exchanges and clearing houses both in the U.S. and abroad
Membership in some of these organizations requires member banks to share in losses to that organization caused by (i) default of another member, and/or (ii) bad investments of margin funds contributed by members.
The maximum liability for losses as a member of some of these organizations can exceed the amount of margin already contributed by that member.
Example: In JP Morgan’s 2022 annual report, they disclosed an off-balance sheet maximum possible exposure (when estimable) for such membership loss responsibilities of over $191 billion.
Financial guarantees
Many of these activities affect both assets and liabilities. For example, a loan commitment represents a promise to transfer money to someone else (which decreases liquidity and demands the same amount of money as if the bank had a debt payment of the same size), but it also represents an asset (the loan asset created once the loan commitment is fulfilled).
The exact impact of these activities on a bank’s balance sheet can be difficult to quantify, but the investor who is determined to extract alpha from bank stocks should at least make the attempt. In my opinion, the most interesting of these OBS activities are contingent liabilities such as pending lawsuits, indemnity agreements, and other guarantees. For example, as of the end of 2022, JP Morgan has a contingent liability which will be realized if certain changes are made to the U.S. tax code. Since cultural, political, and demographic trends suggest significant tax changes will be made over the next 10 years, JPM’s tax-contingent liability is an especially interesting type of contingent liability to analyze. You might be able to anticipate a future miss in the bank’s earnings before other investors realize what is happening.
A Quick Note on Variable Interest Entities (VIEs)
VIEs were a big problem during the financial crisis. However, rules around VIEs have gotten a lot stricter since then, and for the sample of banks I looked at when writing this article, I didn’t note any significant balance sheet distortions due to VIEs.
The maximum potential exposure to losses relative to investments in VIEs is generally limited to the sum of the outstanding book basis and unfunded commitments for future investments.
Appendix B: CECL
One of the most important balance sheet items for banks is the allowance for credit losses (ACL). This is essentially the amount of money the bank expects to lose from borrowers defaulting on loans.
Before 2020, banks used an incurred loss method where they only reported such losses as they were actually incurred. However, that system came with problems. In particular, it systematically overestimated the value of loan assets on a bank’s balance sheet, made the balance sheets of rapidly growing banks appear to be growing even faster than they actually were, did not always account for the differences in yearly loss rates for loans at different points in their life cycles, and did not anticipate increases to expected loan losses based on changing macroeconomic conditions.
Motivated by those shortfalls, regulators devised a replacement for the incurred loss reporting system: CECL.
CECL stands for “Current Expected Credit Losses”. Under CECL, banks must estimate the total losses over the life of a loan (the current expected value of credit losses over the life of a loan) and subtract that total value of those expected losses from the value of the loan asset on the balance sheet.
The new accounting rules do not dictate a particular methodology that banks must use to make CECL estimates, which means a variety of methods have been implemented by different banks. Some of these methods include:
Vintage. Based on historical data. Similar to the incurred loss method.
PD/LGD. Make separate estimates for the probability of a loan defaulting (PD) and the expected loss given default of a loan (LGD).
WARM = Weighted-Average Remaining Maturity. This method uses an open pool concept instead of a closed pool concept.
SCALE = Scaled CECL Allowance for Losses Estimated. This is a method for smaller banks.
Different banks adopted CECL between January 1, 2020 and January 1, 2023. As such, it’s too soon to say how much CECL deviates from real loan losses over time, but given the amount of subjective judgement that can go into CECL estimates, it’s quite possible that bank managers may abuse CECL to underestimate actual expected losses.
Appendix C: Level 3 assets example: Signature Bank
As of December 31, 2021, Signature Bank had $117 billion of financial assets as measured by fair value, and $65 billion (55%) of those were level 3 assets. Over $64 billion of that $65 billion consisted of loans.
Signature’s level 3 assets included pooled trust preferred securities, SBA loan interest-only strip securities (packaged by Signature Bank itself), certain private collateralized mortgage obligations (CMOs), certain commercial loans, private equity investments, and complex OTC derivatives.
Level 3 assets were valued using internally developed valuation techniques and assumptions such as discount rates, credit spreads, default and delinquency rates, and prepayment speeds. Valuation techniques included cash flow and credit analyses.
Appendix D: Off-balance-sheet contingent liabilities are not specific to banks
While large banks often carry a variety of off-balance-sheet (OBS) contingent liabilities from activities including litigation, revolving credit lines, and loan commitments, many types of OBS contingent liabilities are not specific for banks. For example, almost any public company could have OBS contingent liabilities related to:
Litigation (e.g. the healthcare industry has significantly more OBS litigation liability than the banking industry)
VIEs (e.g. many companies in the energy sector have VIEs)
Indemnification agreements
Glossary
ABCP = Asset-Backed Commercial Paper. An ABCP is a short-term money-market security that is issued by a special purpose vehicle (SPV).
ACL = Allowance for Credit Losses
ACLC = Allowance for Credit Losses on Off-Balance Sheet Credit Exposures
ACLLL = Allowance for Credit Losses on Loans and Leases
AFS = Available-for-sale
AFX = American Financial Exchange
AICPA = American Institute of Certified Public Accountants
ALLL = Allowance for Loan and Lease Losses
AMERIBOR = American Interbank Offered Rate (a proposed alternative to LIBOR)
AOCI = Accumulated Other Comprehensive Income
ARM = Adjustable Rate Mortgage
ARO = Asset Retirement Obligation
ARRC = Alternative Reference Rates Committee. The ARRC is a steering committee comprised of large U.S. financial institutions tasked with helping to devise a LIBOR replacement.
ASC = Accounting Standards Codification
ASU = Accounting Standards Update. An ASU is a notice of changes to U.S. GAAP standards issued by FASB.
BHC = Bank Holding Company
BHCA = Bank Holding Company Act of 1956
BOLI = Bank Owned Life Insurance
BSBY = Bloomberg Short-Term Bank Yield Index. This is a credit-sensitive borrowing rate that has been proposed as an alternative to LIBOR.
CAPM = Capital Asset Pricing Model
CDR = Constant Default Rate
CECL = Current Expected Credit Losses. CECL was described in FASB standard ASC 326 as a replacement method for ILM (the Incurred Loss Method) that SEC filers could use to determine an allowance for estimated loan and lease losses. Most SEC filers began using the standard between January 1, 2020 and January 1, 2023.
CECL was created as a replacement to ILM because ILM requires banks to wait until they actually incur losses before updating their loan loss allowances. In the wake of the financial crisis, regulators deemed that approach to be too reactionary so they came up with the CECL method as a replacement. Under CECL, a bank must use historical information, current market conditions, and expectations of the future economic environment when determining allowances for credit losses (ACLs). In other words, ILM is purely backward-looking whereas CECL is also foreward-looking. In theory, that means CECL should be more accurate. In practice, it may be more accurate, but it may also be much less accurate since forward-looking estimates are always easier for a company’s management to manipulate than historical data.
CET1 = Common Equity Tier 1
CFE = Collateralized Financing Entity
CMO = Collateralized Mortgage Obligation
CMT = Constant Maturity Treasury index rate (published by the Federal Reserve)
COFI = Cost of Funds Index. COFI is a federal benchmark interest rate published by Freddie Mac around the 20th of each month and used for some types or mortgage loans and securities. It is calculated by taking the sum of the monthly average interest rates for marketable Treasury bills and Treasury notes, dividing by two, and then rounding to three decimal places.
CRA = Community Reinvestment Act
CRE = Commercial Real Estate
DIF = The FDIC’s Deposit Insurance Fund
DTA = Deferred Tax Asset
DUS = Fannie Mae Delegated Underwriting and Servicing. A DUS MBS is a type of mortgage-backed security. Fannie Mae creates some DUS MBS where a security is backed by a single loan on a mutlifamily asset.
FCA = U.K. Financial Conduct Authority (a UK government body involved in regulating banks), OR False Claims Act (a piece of U.S. legislation)
FCRA = Fair Credit Reporting Act
FDIA = Federal Deposit Insurance Act
FFIEC = Federal Financial Institutions Examination Council. This is an important institution for bank investors to know about because FFIEC publishes “call reports” containing quarterly level bank data.
FHA = Federal Housing Administration
FHFA = Federal Housing Finance Agency (founded in 2008)
FHLB = Federal Home Loan Banks (A set of 11 regional, U.S. government-sponsored banks that are wholesale suppliers of lendable funds to financial institutions of all sizes)
FHLMC = Federal Home Loan Mortgage Corporation (commonly known as Freddie Mac)
FICC = Fixed Income Clearing Corporation
FIRREA = Financial Institutions Reform, Recovery, and Enforcement Act of 1989
FNMA = Federal National Mortgage Association (commonly known as Fannie Mae)
FRB = Federal Reserve Board
GNMA = Government National Mortgage Association (commonly known as Ginnie Mae)
GAAP = Generally Accepted Accounting Principles in the U.S.
GLBA = Gramm-Leach-Bliley Act
GSE = Government-Sponsored Enterprise. In the context of a U.S. bank’s annual report, a reference to GSEs is likely to be a reference to Fannie Mae (FNMA) and/or Freddie Mac (FHLMC).
GSIB = Globally Systemically Important Bank
G7 = Group of 7 Nations:
United States
United Kingdom
Canada
Japan
Germany
France
Italy
HARP = Home Affordable Refinance Program
HELOC = Home Equity Line of Credit
HFI = Held for Investment. HFI loans are loans held for long-term investment purposes and are not expected to be sold.
HFS = Held for Sale. HFS loans are accounted for in a similar way to AFS debt securities at a bank.
HQLA = High-Quality Liquid Assets. These consist of cash and certain other high-quality liquid securities as defined in the LCR rule.
HTM = Held-to-maturity
ILM = Incurred Loss Method (the predecessor to CECL that banks used to determine ALLL — an allowance for loan and lease losses)
IRLC = Interest Rate Lock Commitments
ISDA = International Swaps and Derivatives Association
LCR = Liquidity Coverage Ratio
LDA = Loss Distribution Approach
LGD = Loss Given Default
LIBOR = London Interbank Offered Rate
LIHTC = Low-income housing tax credit
LOC = Letter of credit. An LOC is a document issued by a bank on behalf of one of its customers, authorizing a third party to draw drafts on the bank up to a stipulated amount under specific terms and conditions.
LOCOM (or sometimes LCM) = Lower of Cost or Market. LOCOM is a conservative approach to valuing a financial asset by valuing it at the lower of (1) amortized cost, or (2) fair market value.
OCC = Office of the Comptroller of the Currency. The OCC is an independent bureau within the U.S. Treasury Department that was established by the National Currency Act of 1863. The purpose of the OCC is to charter, regulate, and supervise all national banks, consumer-facing credit unions and other thrift institutions, and federally licensed branches and agencies of foreign banks in the U.S.
OCI = Other Comprehensive Income
OFAC = U.S. Treasury Department Office of Foreign Assets Control
OREO = Other Real Estate Owned. OREO is a bank balance sheet asset consists of real estate that the bank owns but does not use in its business (e.g. properties that were foreclosed on but haven’t been sold at auction).
PCAOB = Public Company Accounting Oversight Board
PCI = Purchase Credit Impaired. PCI is an outdated GAAP category for debt assets that has since been replaced by the more flexible PCD category.
PCD = Purchase Credit Deteriorated. A loan asset is PCD if it is “purchased with more than insignificant credit quality deterioration” since origination. The concept is discussed in detail here.
PD = Probability of Default
RESPA = Real Estate Settlement Procedures Act
RMBS = Residential Mortgage-Backed Securities
ROU = Right-of-Use (Asset). The primary example of an ROU asset is a building you lease.
RUFC = Reserve for Unfunded Lending/Loan Commitments
SCALE = Scaled CECL Allowance for Losses Estimated. SCALE is one of the possible CECL methodologies for calculating a regulatorily acceptable CECL allowance for credit losses (ACL)
SFAS = Statement of Financial Accounting Standards
SOFR = Secured Overnight Financing Rate. SOFR is the average cost (i.e. interest rate) for banks to borrow cash overnight with Treasury securities as collateral. SOFR was selected by the ARRC as its recommended alternative to LIBOR. However, unlike LIBOR, SOFR is a rate that does not take bank credit risk or term into account. As such, it will likely be less correlated with actual funding costs for financial institutions. Other possible alternatives to LIBOR include the Bloomberg Short-Term Yield Index (BSBY), which is a credit sensitive rate.
SPE = Special-Purpose Entity
TDR = Troubled Debt Restructuring
TRS = Total Return Swap
TILA = Truth-in-Lending Act
VIE = Variable Interest Entity. A VIE is a business entity that lacks equity investors or whose equity investors do not have a controlling financial interest in the entity through their equity investments. Instead, a VIE is designed for a person (deemed the “primary beneficiary”) to be able to control it even if that person does not own a majority of the voting rights. Usually this is accomplished through some sort of contractual relationship. A VIE may be any type of business entity (e.g. a limited partnership, corporation, or trust).
WARM = Weighted Average Remaining Maturity. This is a CECL methodology to calculate an allowance for credit losses (ACL). It uses an “open pool/cohort” concept rather than a “closed pool/cohort” concept like some other CECL methodologies.
Q factors (qualitative factors) under CECL are qualitatively estimated variables that go into qualitative adjustments to CECL ACL calculations. Some examples of Q factors that banks may use are (1) the nature of the bank’s financial assets, (2) the quality of the bank’s credit review system, (3) the experience and ability of lending and collections management staff at the bank, (4) expected changes to the general market in a geographic area due to specifics of the local economy, and (5) the possible effect of long-tail “black swan” risks such as natural disasters or material data breaches.
Under U.S. GAAP, a contingency is an existing condition, situation, or set of circumstances involving uncertainty as to possible gain (gain contingency) or loss (loss contingency) to an entity that will ultimately be resolved when one or more future events occur or fail to occur.
Fair value of an asset or liability is defined by GAAP rules as the price that would be received to sell that asset or paid to transfer that liability in an orderly transaction between market participants at the measurement date.
The primary beneficiary of a VIE is the party that has both:
The power to direct the activities of the VIE that most significantly impact the entity’s economic performance, AND
The obligation to absorb losses or the right to receive benefits that could be significant to the VIE.
The primary beneficiary of a VIE is required to consolidate the VIE into their financial statements. An example of a VIE is an investment fund set up as a limited partnership. In that example, the general partner would be the primary beneficiary.
[4] SFAS 166 — New FASB standard in 2009 that eliminated the QSPE exemption from applying VIE accounting
[5] SFAS 167 — New FASB standard in 2009 that replaced the quantitative analysis for consolidation required under FIN 46(R) [relating to QSPE or VIE accounting] with a qualitative analysis
If you enjoyed this article, subscribe to my free weekly(ish) newsletter: The Axiom Alpha Letter (of which this article is an example). I talk about how to build better businesses and portfolios from first principles & data (rather than “best practices” which are often riddled with suboptimal and outdated assumptions).
What is a Master Netting Agreement and How Does it Work? [with Examples]
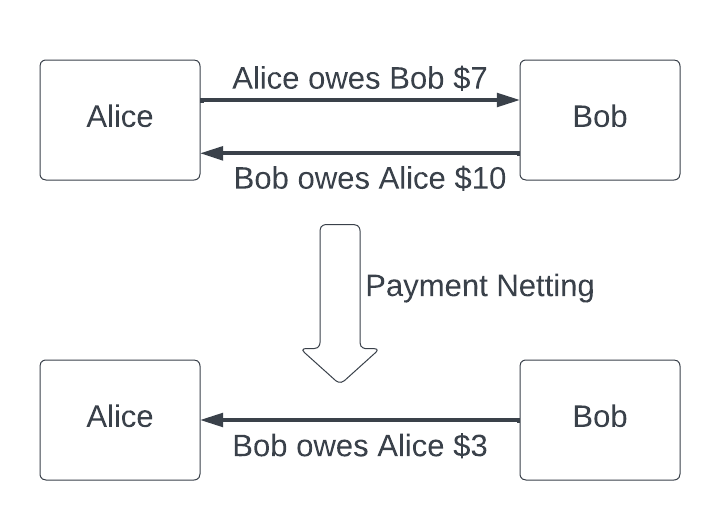
Conceptually, a master netting agreement is very simple. It just says that if Alice owes Bob $7 for ice cream last week and Bob owes Alice $10 for lunch yesterday, then Alice and Bob can settle both debts at once with only one payment of $3 from Bob to Alice.
Stated more formally, a master netting agreement is a single agreement that a company (usually a financial institution such as a bank, broker, or dealer) makes with a counterparty that permits multiple obligations between the two parties to be settled through a single payment in a single currency. A master netting agreement might apply to all transactions and obligations made between the two parties or, more commonly, a specific subset of them.
Sometimes the term “master netting agreement” is meant to include agreements where two parties with ongoing business dealings are settled in net on a periodic basis. However, more commonly, the term specifically refers to an agreement where the “netting” is only triggered when one of the party’s defaults on some obligation.
Example
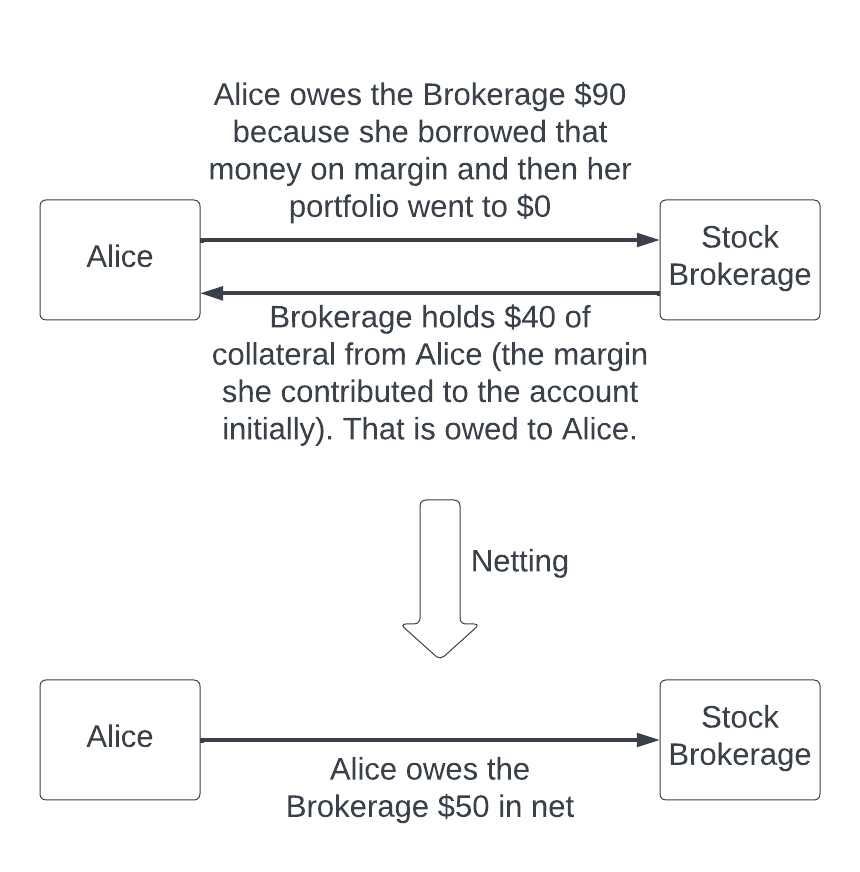
Alice creates a margin trading account with a stock brokerage and funds her account with $40 of initial margin. To create that account, the brokerage makes Alice sign a master netting agreement.
Alice then uses margin account debt to buy a share of a company X for $90. The next day, company X files for bankruptcy and releases a statement that they have no money left in the bank account. The stock plummets to zero before Alice or the stock brokerage can sell the share.
Because Alice bought $90 of sock in a margin account which is now worth zero, she owes the brokerage $90. Alice defaults on that obligation by not reimbursing the brokerage for a decline in her portfolio’s value quickly enough.
However, the stock brokerage also holds $40 of cash collateral (the initial margin that Alice provided to the brokerage when she set up her margin account). Holding collateral means the stock brokerage has a debt to eventually pay that collateral back when Alice closes her account.
To summarize, Alice owes the brokerage $90, and the brokerage owes Alice $40. However, because the two parties have a master netting agreement in place, those two debts can be eliminated and replaced by a single debt for Alice to pay the brokerage $50 (=$90 – $40). This whole process is illustrated succinctly in the diagram below.
Why do master netting agreements matter?
Master netting agreements matter because they reduce counterparty risk. For example, in the example above, suppose the obligations could not be “netted”. Then the stock brokerage would have to pay back Alice’s $40 of initial margin even if Alice never paid any of her $90 debt. The brokerage might end up losing $90 instead of only $50 if Alice goes bankrupt and can’t pay back anything.
In fact, bankruptcy is the most important scenario to consider when contemplating the value of a master netting agreement. During bankruptcy, not every creditor is likely to get paid the full amount they are due. That means if Alice goes bankrupt and creditors get paid 50 cents on the dollar, then the brokerage would much rather be owed only $50 than the full $90. Giving Alice’s bankruptcy estate the $40 that the brokerage owes Alice in the absence of netting would just be subsidizing Alice’s other creditors at the cost of the brokerage taking a larger loss.
Because master netting agreements DO have such a large impact on creditors during bankruptcy, they are legally regulated. Not every contract which purports to control netting is actually legally enforceable. The chapter 11 bankruptcy code and its corresponding regulations define the boundaries of when and what type of master netting agreements are legally enforceable.
Additionally, banks care about master netting agreements because they affect a bank’s liquidity. For that reason, the FDIC, OCC, and Federal Reserve all specify their own definitions of what constitutes a legal master netting agreement for purposes of fulfilling capital adequacy and other banking regulations.
What is a bilateral master netting agreement?
A bilateral master netting agreement is just a master netting agreement where either party can net outstanding obligations if the other defaults. This is in contrast to a master netting agreement where only one party can demand netting if the other defaults.
What is a qualifying master netting agreement?
FDIC definition
According to the FDIC, a qualifying master netting agreement is a written agreement that meets 4 conditions:
The agreement creates a single legal obligation for all individual transactions covered by the agreement upon an event of default following any stay permitted by paragraph (2) of this definition, including upon an event of receivorship, conservatorship, insolvency, liquidation, or similar proceeding, of the counterparty.
The agreement provides the FDIC-supervised institution the right to accelerate, terminate, and close-out on a net basis all transactions under the agreement and to liquidate or set-off collateral promptly upon an event of default, including upon an event of receivorship, conservatorship, insolvency, liquidation, or similar proceeding, of the counterparty, provided that, in any such case, two conditions are met:
(i) Any exercise of rights under the agreement will not be stayed or avoided under applicable law in the relevant jurisdictions, other than:
(A) In receivorship, conservatorship, or resolution under the Federal Deposit Insurance Act, Title II of the Dodd-Frank Act, or under any similar insolvency law applicable to GSEs, or laws of foreign jurisdictions that are substantially similar to those, in order to facilitate the orderly resolution of the defaulting counterparty, or
(B) Where the agreement is subject by its terms to, or incorporates, any of the laws referenced in (A).
(ii) The agreement may limit the right to accelerate, terminate, and close-out on a net basis all transactions under the agreement and to liquidate or set-off collateral promptly upon an event of default of the counterparty to the extent necessary for the counterparty to comply with the requirements of 12 CFR part 382, 12 CFR subpart I of part 252, or 12 CFR part 47, as applicable.
The agreement does not contain a walkaway clause (that is, a provision that permits a non-defaulting counterparty to make a lower payment than it otherwise would make under the agreement, or no payment at all, to a defaulter or the estate of a defaulter, even if the defaulter or the estate of the defaulter is a net creditor under the agreement); and
In order to recognize an agreement as a qualifying master netting agreement for purposes of 12 CFR part 329, subpart A, an FDIC-supervised institution must comply with the following requirements from 12 CFR 239.4(a) with respect to that agreement:
(1) The FDIC-supervised institution must conduct a sufficient legal review to conclude with a well-founded basis (and maintain sufficient written documentation of that legal review) that:
(i) The agreement meets the other requirements for the definition of “qualifying master netting agreement” that we have already stated.
(ii) In the event of a legal challenge (including one resulting from a default or from receivorship, bankruptcy, insolvency, liquidation, resolution, or similar proceeding) the relevant judicial and administrative authorities would find the agreement to be legal, valid, binding, and enforceable under the law of the relevant jurisdictions; and
(2) The FDIC-supervised institution must establish and maintain written procedures to monitor possible changes in relevant law and to ensure that the agreement continues to satisfy the requirements of the definition of qualifying master netting agreement previously mentioned.
Federal Reserve definition
According to the Federal Reserve, a qualifying master netting agreement is defined as an agreement that just meets the first two of the four FDIC conditions, with two changes:
The phrase “FDIC-supervised institution” is replaced with “Board-regulated institution”
In condition part (2)(ii) of the FDIC definition, “12 CFR subpart 1 of part 252” is replaced with “the Board’s Regulation YY (12 CFR part 252)”
OCC definition
According to the OCC, a qualifying master netting agreement is defined as an agreement meeting just the first two of the four FDIC conditions, with one change:
All instances of the phrase “FDIC-supervised institution” are changed to “national bank or Federal savings association”
Basel iii definition
A master netting agreement is considered legally enforceable under the Basel iii leverage ratio framework if it satisfies the conditions in paragraphs 8(c) and 9 of the Annex to the Basel III leverage ratio framework and disclosure requirements.
ISDA master netting agreement
The International Swaps and Derivatives Association (ISDA) has published template “master netting agreements”, although in some areas (such as energy transactions) such templates are rarely used, with dealers instead typically using bespoke master netting agreements.
Here is an example of an ISDA master netting agreement between Bank of America and Katy Industries: ISDA Master Agreement Example
Here is another example of an ISDA master netting agreement between Bank of America and Natural Alternatives International: ISDA Master Agreement Example 2
Glossary
GMRA = Global Master Repurchase Agreement
ICMA = International Capital Market Association
ISDA = International Swaps and Derivatives Association
[2] 11 U.S.C. 561 — Contractual right to terminate, liquidate, accelerate, or offset under a master netting agreement and across contracts; proceedings under chapter 15
Appendix: How does JP Morgan use Master Netting Agreements?
JP Morgan’s 2022 annual report defines a master netting agreement as follows.
“A master netting agreement is a single agreement that a bank, broker, or dealer makes with a counterparty that permits multiple transactions governed by that master netting agreement to be terminated or accelerated and settled through a single payment in a single currency in the event of a default (e.g. bankruptcy, failure to make a required payment or securities transfer, or failure to deliver collateral or margin when due).”
Throughout the bank’s 2022 annual report, the company describes how it uses master netting agreements to reduce credit / counterparty / settlement risk as well as how its reported financials are affected by netting agreements. The following excerpts capture the key disclosures and explanations from the bank about how it uses and accounts for netting agreements:
Excerpt 1
“The fair value of derivative receivables reported on the Consolidated balance sheets were $70.9 billion adn $57.1 billion at December 31, 2022 and 2021, respectively… Derivative receivables represent the fair value of the derivative contracts after giving effect to legally enforceable master netting agreements and the related cash collateral held by the Firm.
In addition, the Firm held liquid securities and cash collateral that may be used as security when the fair value of the client’s exposure is in the Firm’s favor. For these purposes, the definition of liquid securities is consistent with the definition of high quality liquid assets as defined in the LCR rule.
In management’s view, the appropriate measure of current credit risk should also take into consideration other collateral, which generally represents securities that do not qualify as high quality liquid assets under the LCR rule. The benefits of these additional collateral amounts for each counterparty are subject to legally enforceable master netting agreement and limited to the net amount of the derivative receivables for each counterparty.”
JPM 2022 form 10-K, page 124
Excerpt 2
“As permitted under U.S. GAAP, the Firm has elected to net derivative receivables and derivative payables and the related cash collateral received and paid when a legally enforceable master netting agreement exists. The level 3 balances would be reduced if netting were applied, including the netting benefit associated with cash collateral.
The Firm also holds additional collateral (primarily cash, G7 government securities, other liquid government agency and guaranteed securities, and corporate debt and equity securities) delivered by clients at the initiation of transactions, as well as collateral related to contracts that have a non-daily call frequency and collateral that the Firm has agreed to return but has not yet settled as of the reporting date. Although this collateral does not reduce the balances and is not included in the tables below, it is available as security against potential exposure that could arise should the fair value of the client’s derivative contracts move in the Firm’s favor.”
JPM 2022 form 10-K, page 174, footnote (f)
The level 3 balances referred to by the above excerpt are JP Morgan’s “level 3 assets” in the fair value hierarchy. These are the assets whose fair value measurements have the highest degree of uncertainty because no identical or similar assets are actively traded and unobservable variables significantly impact the final fair values calculated.
Excerpt 3
“The Firm’s wholesale exposure is managed through loan syndications and participations, loan sales, securitizations, credit derivatives, master netting agreements, collateral and other risk-reduction techniques.”
JPM 2022 form 10-K, page 192
Excerpt 4
“The following tables present, as of December 31, 2022 and 2021, gross and net derivative receivables and payables by contract and settlement type. Derivative receivables and payables, as well as the related cash collateral from the same counterparty, have been netted on the Consolidated balance sheets where the Firm has obtained an appropriate legal opinion with respect to the master netting agreement. Where such a legal opinion has not been either sought or obtained, amounts are not eligible for netting on the Consolidated balance sheets, and those derivative receivables and payables are shown separately in the tables below.
In addition to the cash collateral received and transferred that is presented on a net basis with derivative receivables and payables, the Firm receives and transfers additional collateral (financial instruments and cash). These amounts mitigate counterparty credit risk associated with the Firm’s derivative instruments, but are not eligible for net presentation:
Collateral that consists of liquid securities and other cash collateral held at third-party custodians, which are shown separately as “Collateral not nettable on the Consolidated balance sheets” in the tables below, up to the fair value exposure amount. For the purpose of this disclosure, the definition of liquid securities is consistent with the definition of high quality liquid assets as defined in the LCR rule.
The amount of collateral held or transferred that exceeds the fair value exposure at the individual counterparty level, as of the date presented, which is excluded from the tables below.
Collateral held or transferred that relates to derivative receivables or payables where an appropriate legal opinion has not been either sought or obtained with respect to the master netting agreement, which is excluded from the tables below.”
JPM 2022 form 10-K, page 199
Excerpt 5
“[The] Firm typically enters into master netting agreements and other similar arrangements with its counterparties, which provide for the right to liquidate the underlying securities and any collateral amounts exchanged in the event of a counterparty default.”
JPM 2022 form 10-K, page 222 (on credit risk mitigation practices)
Bank balance sheets are filled with lies because the majority of assets on their balance sheet are usually reported at “amortized cost” rather than “fair value”. When interest rates go up, the difference between amortized cost and fair value can grow dramatically. The conversion rate between the balance sheet value of assets and the fair value of assets is usually buried in one or more of the “notes to consolidated financial statements” in a bank’s annual report.
Below is a reconstructed summary of First Republic’s balance sheet, both as originally presented in the company’s 2022 10-K as well as the same balance sheet after revaluing all assets and liabilities at fair value.
See that bottom-right cell in the table? The red one with the negative sign? That’s the gaping hole that appears in First Republic’s balance sheet when you use the bank’s own estimated fair values of their assets and liabilities instead of the made-up accounting values that they report by default.
I’m honestly amazed that the bank has not been shut down yet like Silicon Valley Bank and Signature Bank were last week. At this point, it’s irresponsible for any business to still have more than $250k deposited at First Republic. Also RIP to any investors who are long the stock.
Barney Frank is a retired Democratic congressman who co-authored the Dodd-Frank Act (the set of new banking regulations that came in the wake of the Financial Crisis) and sat on the board of Signature Bank before it was shut down on Sunday.
“I think that if we’d been allowed to open tomorrow, that we could’ve continued. We have a solid loan book. We’re the biggest lender in New York City under the low-income housing tax credit… I think the bank could’ve been a going concern…[The regulators] wanted to send a message to get people away from crypto… We were singled out to be the poster child for that message.”
Barney Frank (speaking hours after Signature Bank was shut down)
In more detail, here is Barney’s explanation of exactly what happened to Signature Bank between Friday, March 10th and Sunday, March 12th:
“On Friday afternoon, we got hit by billions and billions of dollars of withdrawals […out of] reaction to what happened to Silicon Valley Bank. If [the Fed and FDIC statement] had been announced on Friday [instead of Sunday] we would have had no problem at all… we cater mostly to commercial lenders. We’re a big [low-income] housing developer, which is one of the things I liked about our role. So we had a lot of large depositors who were uninsured, and they panicked knowing we were involved in crypto.
We explained to them that it was crypto in a very responsible way that didn’t expose us, but they didn’t want to hear it. They just wanted to move to JP Morgan or Bank of America just in case. The way crypto hurt us was [just that] we were involved in crypto, although as I said, in a way different than SVB, and had large uninsured depositors. They panicked and fled.
What the Fed did, what the FDIC said, that they’d back up uninsured depositors and make a liquidity facility open at the Fed — THAT would’ve kept us from having a problem….[but regardless] I believe by Sunday we had resolved [our liquidity problem], finding more capital, and the deposit outflows stopped. I believe that the regulators stepped in even after we had managed to stabilize that because of a determination to get people to step away from crypto, and we were the posterchild for that decision.”
Those are big allegations. Are they true? Did regulators really shut down a solvent bank without liquidity issues just because they didn’t like crypto?
Let’s take a look at the public data.
Both SVB and Signature Bank experienced a boom and bust of pandemic deposits
Government stimulus caused total bank deposits to grow 36.1% from the beginning of 2020 to the end of 2021. Over the same time period, SVB saw deposit growth of 206%. That massive surge in deposits put pressure on SVB’s management to invest in long-term, low-yielding, fixed-rate bonds and loans in an attempt to generate a return on all that deposit cash. Signature had similar pressure with deposit growth of 165% during that time period.
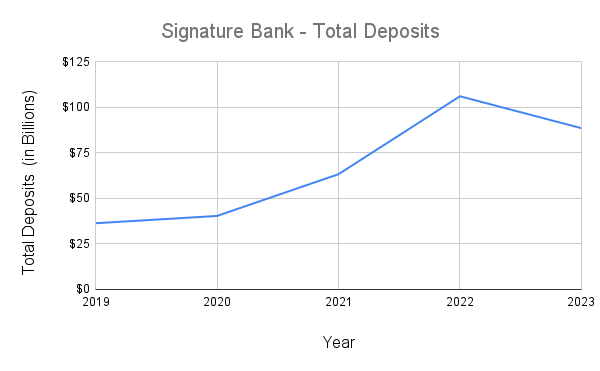
After the surge in deposit growth, both SVB and Signature Bank experienced more severe deposit shrinkage (as measured by percentage) than overall deposits in U.S. commercial banks. That put liquidity pressure on SVB which contributed to its collapse. By looking at the data below taken from Signature Bank’s annual reports, we can see that Signature also suffered a significant drop in liquidity from the end of 2021 to the end of 2022.
2021
2022
YoY Change
Cash
$29.55 Billion
$5.87 Billion
–80.1%
Securities (Investments)
$22.15 Billion
$26.37 Billion
+19.1%
Loans & leases, net
$64.39 Billion
$73.80 Billion
+14.6%
Total assets
$118.45 Billion
$110.36 Billion
–6.8%
Total deposits
$106.13 Billion
$88.59 Billion
–16.5%
Cash-to-Deposit Ratio
27.84%
6.63%
Illiquid securities and loans were UP over 15%, total assets were DOWN almost 7%, and liquid cash and short term securities were DOWN over 80%! Signature’s overall liquidity at the end of 2022 was WAY DOWN from what it was at the end of 2021, and that’s despite the bank raising more than $730 million from selling stock in 2022.
Cash alone fell by almost $24 billion at the same time that illiquid loans increased over $10 billion. Cash was being both withdrawn and converted to illiquid assets in huge volumes at the same time.
Signature Bank was more illiquid than its balance sheet disclosed
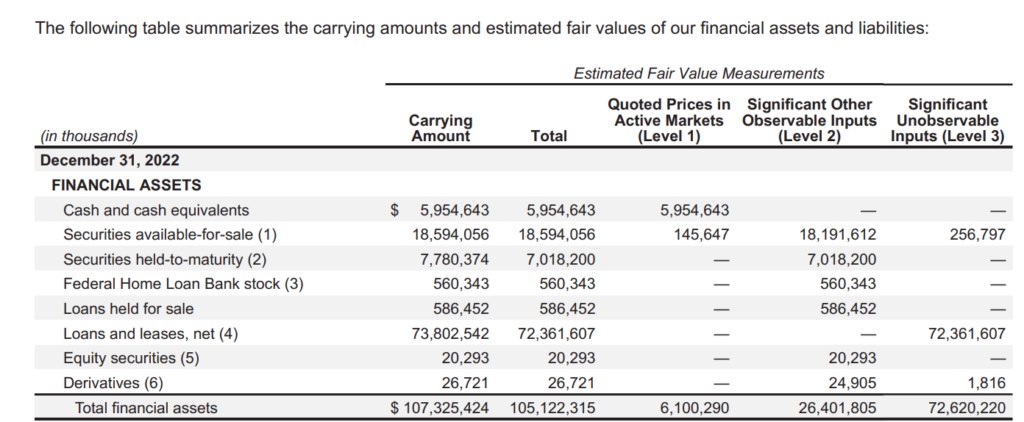
According to Signature’s latest 10-K, the bank had $110.36 billion of assets, $102.35 billion of liabilities, and $8.01 billion of shareholders’ equity. That’s $8 billion to cover any losses on $102 billion of leverage. Except buried deep in the pages of that same 10-K, you’ll find a disclosure that the assets on the balance sheet are overvalued by more than $2.2 billion:
Look at the bottom row of the table from the screenshot. “Carrying amount” is the value of financial assets on the balance sheet. “Total” is the value of those same assets when valued “fairly” rather than with the accounting tricks that banks use as standard procedure on their balance sheets. That missing $2.2 billion means the true shareholders’ equity is actually less than 73% of the reported shareholders’ equity. That’s a much smaller cushion to absorb losses, AND it gets worse.
Notice how the row labeled “Loans and leases, net” has the fair value reported in the last column labeled “Significant Unobservable Inputs (Level 3)”? That means the “fair value” of the bank’s loans is actually calculated by the banks managers because there isn’t an actively traded market of similar loans to compare to. When bank managers have that opportunity, they are often tempted to overestimate what is actually “fair”. That means the market value of those loans, should they need to be unloaded to cover deposit withdrawals, may be even less than the reported “fair value”.
In fact, it is INCREDIBLY likely that the true value of those loans is less than the reported “fair value” because the average yield on the bank’s interest-earning assets at the end of 2022 was only 3.10%, but even 3-month Treasury bills currently yield 4.70%. Based on the breakdown of loan maturities disclosed by Signature, it seems likely that their actual loan portfolio is worth at least $1 billion less than their estimated “fair value”. And that’s assuming an orderly sale. In a real bank run, it seems very likely that the loans would sell for even less. That doesn’t seem quite as optimistic a situation as former congressman and board member Barney Frank suggested.
Signature Bank played stupid games
In 2022, Signature Bank issued over $167 million in dividends, and it also raised over $730 million by selling additional stock. Issuing dividends is a way of returning money to shareholders. Selling stock is a way of taking money from shareholders. Doing both at the same time is like asking your mom for a $100 gift just so that you can spend that $100 at her boutique store, paying taxes along the way. Effectively, you turn $100 in her pocket into $70 in her pocket. A company that issues dividends and sells more stock at the same time is a company with illogical managers. Illogical managers create unstable banks.
Takeaway: There are clear signs that Signature Bank may have not been as well-run or as well capitalized as its managers and board members claimed. It seems likely that New York’s bank regulators were accurate in their assessment of the bank’s solvency and liquidity problems.
Appendix A: What was Signature Bank’s business model?
In the words of Signature Bank’s management:
“We distinguish ourselves by focusing on our target market: privately owned businesses, their owners, and their senior managers, as well as private equity firms and their general partners.”
Almost 90% of the bank’s deposits (88.17% to be exact) were business deposits as of December 31, 2022. Deposits from digital asset businesses alone totaled $17.79 billion (20% of total deposits). Unfortunately, about 90% of the deposits were also uninsured.
During 2022, deposits declined by $17.54 billion (16.5%) to $88.59 billion. That was largely due to a decline in digital asset banking deposits which decreased $12.39 billion.
The average cost for total deposits in 2022 was 0.88%.
Appendix B: Additional quotes from Barney Frank
BARNEY FRANK: “What you also had was, it wasn’t just Silicon Valley[ Bank]. It was a punishment for anybody involved in crypto… And I think in fact what happened was, we had gotten into crypto, although in a way that in no way put us at risk. We facilitated our customers who wanted to deal with each other in crypto, but we were known as someone that was doing crypto… and there was this fleeing [from] banks that were seen as crypto… now it was a liquidity issue not a solvency issue, and we had by Sunday actually gotten back to a point where we had the liquidity, but I believe the regulators wanted to send a message that crypto is toxic, frankly, and they wanted to tell everybody to get as far away from crypto as they could, and we were singled out to be the poster child for that message.”
BARNEY FRANK: “I think some of the regulators were a little nervous they had been a little too accommodating to crypto.”
BARNEY FRANK: “On Friday afternoon, we got hit with billions and billions of dollars of withdrawals of deposits… I believe by Sunday we had resolved that, finding more capital, and the deposit outflows stopped. I believe that the regulators stepped in even after we had managed to stabilize that because of a determination to get people to step away from crypto, and we were the posterchild for that decision.”
Will Credit Unions be Affected by Silicon Valley Bank (SVB)’s Failure?
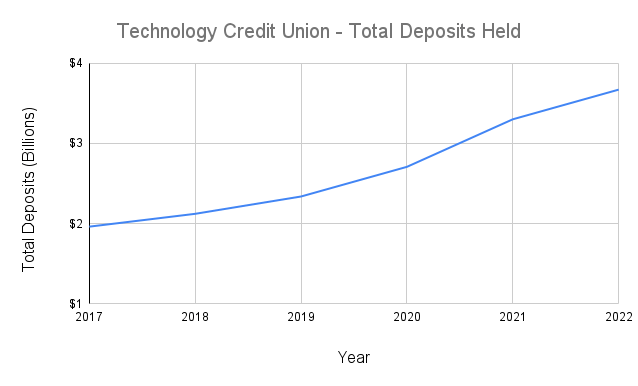
“Even Tech CU (a Silicon Valley credit union catering to tech workers) only grew its deposits by 35.6% from the beginning of 2020 to the end of 2021. That’s almost 6 times less than the deposit growth of Silicon Valley Bank during the same time period.”
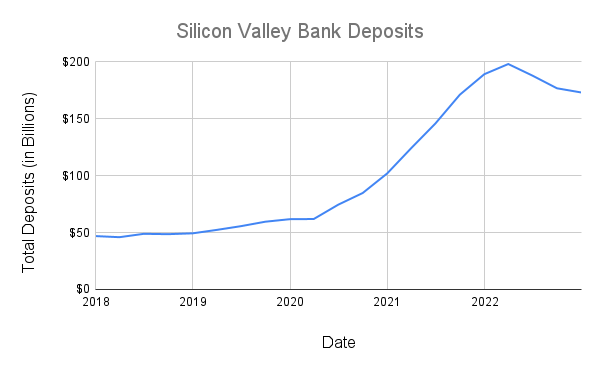
Silicon Valley Bank (SVB) failed because (1) it received a HUGE amount of deposits during the pandemic, (2) it couldn’t lend out the money fast enough so it bought lots of long-duration, low-yield investments, (3) it didn’t hedge interest rate risk on those investments, and (4) The Fed raised interest rates significantly after the pandemic, causing the low-yield investments to lose value at the same time as deposits decreased due to a slowly economy.
Most credit unions also received a surge of deposits due to pandemic government stimulus, but the magnitude of their deposit growth was SIGNIFICANTLY less than the deposit growth of SVB.
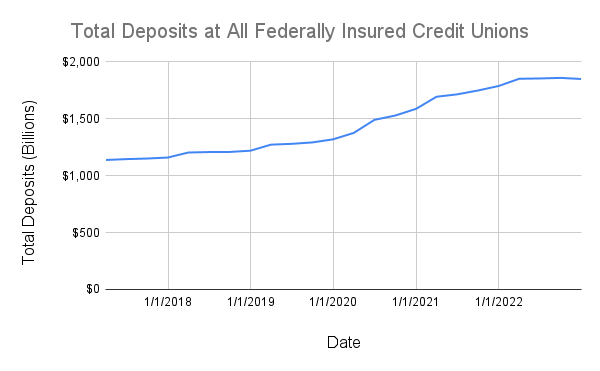
The chart below shows the total deposits at all federally insured credit unions.
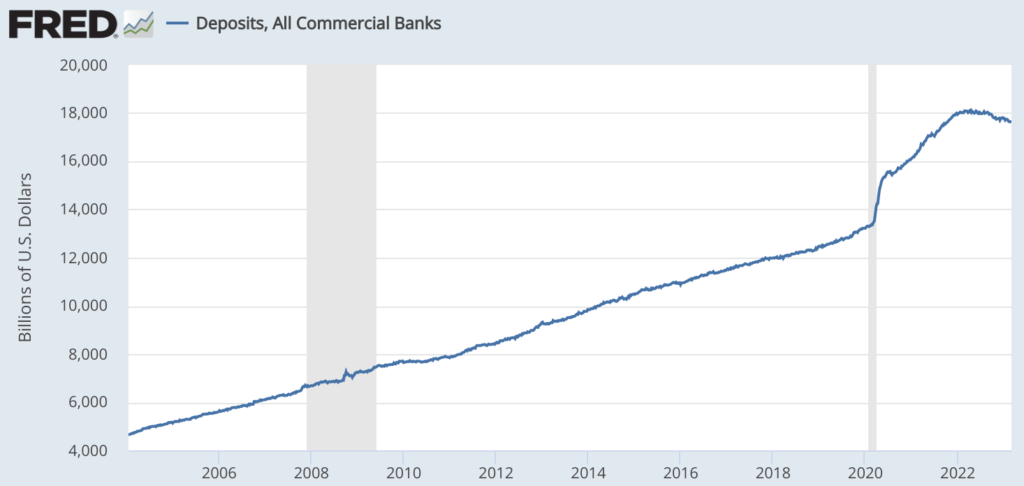
From the beginning of 2020 through the end of 2021, total deposits at federally insured credit unions grew 35.5%. This is roughly the same percentage as overall deposit growth at U.S. commercial banks during that time (36.1%, charted below).
By comparing those two charts, it would seem that the deposit pressure on banks and credit unions is about the same. However, the banking system has more high-risk outliers than the credit union system has. The most stark example of this is SVB itself.
From the start of 2020 to the start of 2022, SVB’s deposits grew 206% (versus the average bank which grew deposits by only 36.1%!). First Republic Bank (NYSE: FRC) grew average deposits by 64.4% from 2020 to 2022. Western Alliance Bank grew deposits by 109%. Each of these banks focused on businesses and/or business owners rather than ordinary consumers, and the booming tech and real estate markets during the pandemic meant these banks experienced deposit growth much more than the average bank.
In contrast, credit unions tend to serve employees of certain organizations as their customers. Because cash flow for an employee tends to be more stable than cash flow for a business owner or business entity, credit unions have somewhat less volatility in deposits than banks. Even Tech CU (a Silicon Valley credit union catering to tech workers) only grew its deposits by 35.6% from the beginning of 2020 to the end of 2021. That’s only 0.1% higher growth than the average federally insured credit union and almost 6 times less than the deposit growth of Silicon Valley Bank during the same time period.
Other credit unions that you might suspect of being overexposed to tech or business include:
First Tech Federal Credit Union (19.2% growth in deposits over the 2-year span of 2020-2021)
Patelco Credit Union (28.8% growth in deposits)
Digital Federal Credit Union (11.5% growth in deposits)
Seattle Credit Union (28.0% growth in deposits over the 3-year span of 2019-2021)
How can the most tech-related credit unions have grown deposits by smaller percentages than the overall credit union system?
The answer is that much of the growth in overall credit union deposits was due to an increase in the number of Americans who use credit unions (about 15 million additional people started using credit unions between 2019 and 2021), and those were concentrated in a few major credit unions. In contrast, only about 1 million additional Americans signed up for a bank account during that period.
What does all of this mean? Are credit unions at risk of collapse?
Most credit unions (even credit unions with a concentration of customers in the tech industry) have not experienced anywhere near the level of deposit growth that some banks have during the pandemic years. As a result, they were not pressured into buying tons of investments yielding less than 2% like SVB or similar banks were. They still might have bought such investments anyway, but hopefully not as many given that they were under less pressure. Unfortunately, it’s hard to verify that because most credit unions don’t publish audited (or even very detailed) financial statements.
NOTE: Even if credit unions DID buy a bunch of investments yielding less than 2% back when interest rates were low, it’s still unlikely that they would suffer the same fate as SVB. For one thing, banks almost always hedge their interest rate risk (but SVB did not). Small credit unions might not hedge as much as they should, but large credit unions probably do, and interest rate hedging could have prevented SVB’s collapse.
NOTE 2: A run on a bank (or credit union) can destroy even a strong bank (or credit union). That means any credit union can fail if enough people lose confidence in it. Since credit unions are much smaller than the largest banks and since they tend to serve individuals rather than businesses, they are unlikely to be deemed “systemic risks” by any government agency. That means if a credit union does fail, there is very little chance of getting back all of your money if you have more than $250,000 deposited.
Are credit unions safer than banks during recessions?
During the Great Recession, credit unions were statistically less likely to fail than banks. One reason why is that credit unions are non-profits where the customers are also the owners. That reduces the incentive for owners to take risky bets with deposit money.
NCUA vs FDIC: What’s the difference?
FDIC and NCUA are both federal government agencies which provide insurance to depository institutions. Both agencies offer essentially the same insurance up to $250,000 per account. The only significant difference is that the FDIC provides insurance to banks while the NCUA provides insurance to credit unions.
How big is the credit union industry?
As of December 31, 2022, there were 4,760 federally insured credit unions which collectively held $2.17 trillion of total assets (up 5.2% from Q4 2021 but down 2.3% from Q1 2022).
However, only 421 of those held at least $1 billion of assets, and those 421 credit unions collectively held $1.6 trillion of total assets (75% of all assets held by federally insured credit unions).
The total number of credit union members/customers as of the end of 2022 was 135.3 million.
How profitable are credit unions?
The return on average assets for federally insured credit unions in 2022 was 0.89%, down from 1.07% in 2021. The median return on average assets across all federally insured credit unions was 0.51%, up from 0.50% in 2021.