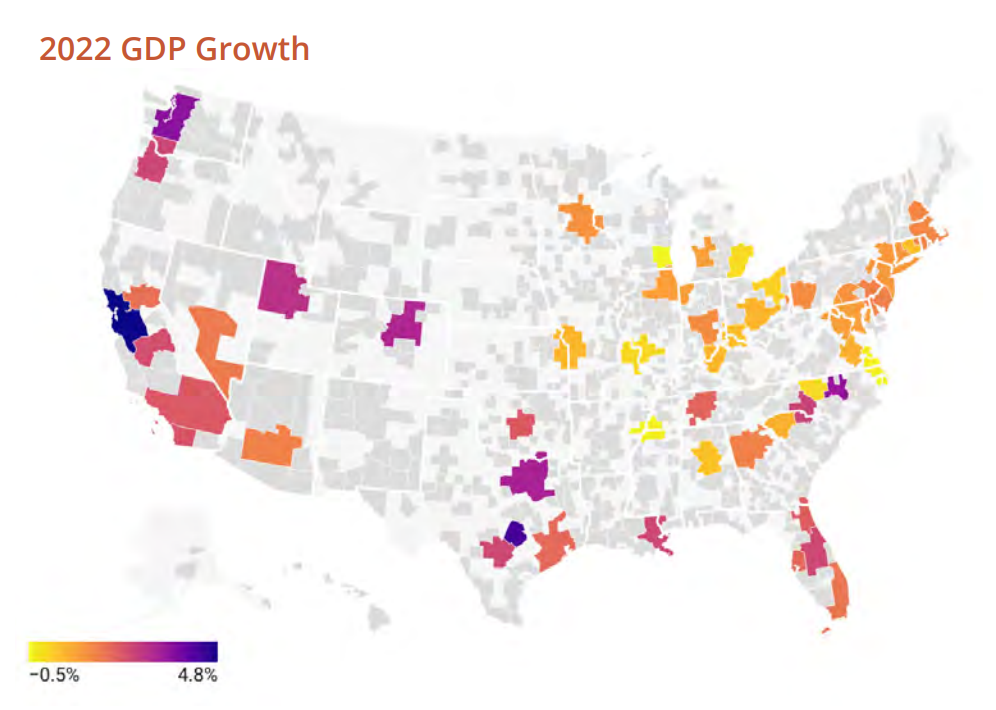
In this article, we rank the 50 largest EMAs (Extended Metrpolitan Areas) by their annualized growth rate, as estimated in Q3 2022 from a variety of data sources. Together, these 50 EMA’s represent 65% of the U.S. population and 72% of total U.S. economic activity.
| Rank | City (EMA) | Q3 2022 GDP Annualized Growth Rate | GDP Share of U.S. Total (2022) | Population Share of U.S. Total (2020) | GDP % per Population % (U.S. Total) |
| 1 | San Francisco Bay Area, CA | 4.8% | 5.5% | 2.9% | 1.9 |
| 2 | Austin, TX | 4.3% | 0.9% | 0.7% | 1.3 |
| 3 | Seattle, WA | 3.5% | 2.3% | 1.5% | 1.5 |
| 4 | Raleigh and Durham, NC | 3.4% | 0.8% | 0.6% | 1.3 |
| 5 | Dallas, TX | 3.1% | 2.7% | 2.5% | 1.1 |
| 6 | Denver, CO | 3.0% | 1.3% | 1.1% | 1.2 |
| 7 | Salt Lake City, UT | 2.8% | 0.8% | 0.8% | 1.0 |
| 8 | Charlotte, NC | 2.5% | 0.9% | 0.9% | 1.0 |
| 9 | New Orleans, LA | 2.4% | 0.4% | 0.5% | 0.8 |
| 10 | Orlando, FL | 2.4% | 1.0% | 1.3% | 0.8 |
| 11 | Portland, OR | 2.4% | 1.0% | 1.0% | 1.0 |
| 12 | San Antonio, TX | 2.4% | 0.7% | 0.8% | 0.9 |
| 13 | Fresno, CA | 2.3% | 0.3% | 0.4% | 0.8 |
| 14 | San Diego, CA | 2.2% | 1.2% | 1.0% | 1.2 |
| 15 | Los Angeles, CA | 2.1% | 6.0% | 5.6% | 1.1 |
| 16 | Oklahoma City, OK | 2.1% | 0.4% | 0.5% | 0.8 |
| 17 | Jacksonville, FL | 2.0% | 0.5% | 0.5% | 1.0 |
| 18 | Nashville, TN | 1.9% | 0.7% | 0.6% | 1.2 |
| 19 | Houston, TX | 1.8% | 2.4% | 2.2% | 1.1 |
| 20 | Tampa, FL | 1.8% | 0.8% | 1.0% | 0.8 |
| 21 | Sacramento, CA | 1.7% | 0.8% | 0.8% | 1.0 |
| 22 | Miami and Fort Lauderdale, FL | 1.6% | 1.9% | 2.1% | 0.9 |
| 23 | Las Vegas, NV | 1.5% | 0.6% | 0.7% | 0.9 |
| 24 | Phoenix, AZ | 1.4% | 1.4% | 1.5% | 0.9 |
| 25 | Atlanta, GA | 1.4% | 2.2% | 2.1% | 1.0 |
| 26 | Philadelphia, PA | 1.4% | 2.4% | 2.2% | 1.1 |
| 27 | Boston, MA | 1.3% | 3.2% | 2.6% | 1.2 |
| 28 | Pittsburgh, PA | 1.2% | 0.8% | 0.8% | 1.0 |
| 29 | Indianapolis, IN | 1.2% | 0.8% | 0.8% | 1.0 |
| 30 | Harrisburg, PA | 1.1% | 0.3% | 0.4% | 0.8 |
| 31 | Minneapolis and St. Paul, MN | 1.1% | 1.4% | 1.2% | 1.2 |
| 32 | New York, NY | 1.0% | 9.7% | 7.1% | 1.4 |
| 33 | Chicago, IL | 0.9% | 3.3% | 3.0% | 1.1 |
| 34 | Grand Rapids, MI | 0.9% | 0.3% | 0.4% | 0.8 |
| 35 | Washington, D.C. and Baltimore, MD | 0.9% | 3.8% | 3.0% | 1.3 |
| 36 | Richmond, VA | 0.6% | 0.4% | 0.4% | 1.0 |
| 37 | Greenville, SC | 0.6% | 0.3% | 0.4% | 0.8 |
| 38 | Kansas City, MO and Kansas City, KS | 0.5% | 0.7% | 0.8% | 0.9 |
| 39 | Columbus, OH | 0.5% | 0.7% | 0.8% | 0.9 |
| 40 | Louisville, KY | 0.5% | 0.4% | 0.5% | 0.8 |
| 41 | Hartford, CT | 0.4% | 0.5% | 0.4% | 1.3 |
| 42 | Cincinnati, OH | 0.4% | 0.7% | 0.7% | 1.0 |
| 43 | Birmingham, AL | 0.3% | 0.3% | 0.4% | 0.8 |
| 44 | Cleveland, OH | 0.1% | 1.0% | 1.1% | 0.9 |
| 45 | Greensboro, NC | 0.0% | 0.4% | 0.5% | 0.8 |
| 46 | St. Louis, MO | 0.0% | 0.8% | 0.9% | 0.9 |
| 47 | Detroit, MI | -0.1% | 1.4% | 1.6% | 0.9 |
| 48 | Memphis, TN | -0.4% | 0.4% | 0.4% | 1.0 |
| 49 | Virginia Beach, VA | -0.4% | 0.5% | 0.6% | 0.8 |
| 50 | Milwaukee, WI | -0.5% | 0.6% | 0.6% | 1.0 |
Appendix
The data presented above was produced by researchers at UNC Chapel Hill as part of the American Growth Project. The EMA’s are regions constructed by the researchers to represent geographically connected local economies and don’t necessarily match county or traditional MSA (metropolitan statistical area) designations.