The cap rate of a rental property is the net operating income (NOI) of the property divided by the property’s value.
NOI = (Total rent) – (All property-related expenses except debt payments)
Property-related expenses include HOA fees, property taxes, insurance, and maintenance costs. Since the costs of maintenance and insurance vary substantially from one city to another, it’s hard to get good numbers to estimate average cap rates for different cities. However, we can at least get a general idea of what cap rates are like by looking at what I will call, for purposes of this article, “net rent” (which is just rent minus any HOA fees).
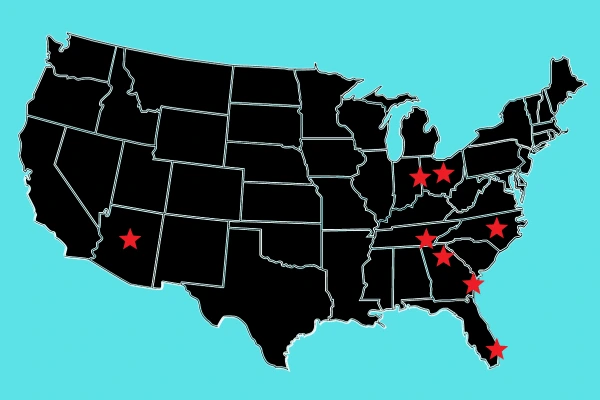
In the rest of this article, I look at 9 different U.S. cities. For each city, I sample the 5 most recently sold rent-ready residential properties on Zillow and calculate the annual net rent-to-price ratio using the sale price of the property and the rental Zestimate. This methodology isn’t perfect, but it’s a pretty good rough estimate for the range of cap rates in a given area.
NOTE: Expect cap rates to be at least 1-2% lower than the rent-to-price ratios listed below due to the costs of maintenance and taxes. Based on this adjustment as well as the age of the houses being sold in each city, I’ve provided an approximate range of cap rates you can expect for each city.
1. West Palm Beach, Florida
Cap rates are roughly 3.0% to 7.2% in West Palm.
Table 1: Recently sold properties in West Palm Beach, FL
| Street Address | Description | Price | Rental Zestimate | Monthly HOA Fees | Annual Net Rent-to-Price Ratio |
| 6148 Azalea Circle | Single family – 3 bed, 2 bath, 1518 sq ft, built 2003 | $427,000 | $2,900 | $154 | 7.72% |
| 1234 Winding Rose Way | Single family – 4 bed, 2 bath, 1584 sq ft, built 2004 | $460,000 | $2,900 | $154 | 7.16% |
| 5857 Cassandra Court | Single family – 4 bed, 3 bath, 1596 sq ft, built 1985 | $375,000 | $2,884 | $154 | 8.74% |
| 315 Avila Road | Single family – 2 bed, 2 bath, 1640 sq ft, built 1955 | $1.01 Million | $4,855 | None | 5.77% |
| 255 Evernia Street, Apt 306 | Condo – 1 bed, 1 bath, 766 sq ft, built 2002 | $580,000 | $2,600 | $406 | 4.54% |
2. Port Saint Lucie, Florida
Cap rates are roughly 5.0% to 6.5% in Port Saint Lucie.
Table 2: Recently sold properties in Port Saint Lucie, FL
| Street Address | Description | Price | Rental Zestimate | Monthly HOA Fees | Annual Net Rent-to-Price Ratio |
| 433 SW Fairway Point | Single family – 2 bed, 2 bath, 1363 sq ft, built 1995 | $355,000 | $2,248 | $292 | 6.61% |
| 1225 NW Sun Terrace Circle, Apt B | Townhome – 2 bed, 2 bath, 1152 sq ft, built 1992 | $278,000 | $1,966 | $320 | 7.11% |
| 806 SW Saint Andrews Cv | Single family – 3 bed, 2 bath, 1679 sq ft, built 2001 | $362,000 | $2,600 | $278 | 7.70% |
| 801 SE Forgal St | Single family – 5 bed, 2 bath, 3000 sq ft, built 1980 | $440,000 | $2,999 | None | 8.18% |
| 1549 SE Minorca Ave | Single family – 2 bed, 2 bath, 932 sq ft, built 1977 | $305,000 | $1,999 | None | 7.86% |
3. Savannah, Georgia
Cap rates are roughly 5.8% to 8.1% in Savannah.
Table 3: Recently sold properties in Savannah, GA
| Street Address | Description | Price | Rental Zestimate | Monthly HOA Fees | Annual Net Rent-to-Price Ratio |
| 24 Orchid Ln | Townhome – 3 bed, 2 bath, 1490 sq ft, built 2005 | $244,000 | $1,991 | Unknown (assuming none) | 9.79% |
| 77 Knollwood Ln | Townhome – 3 bed, 3 bath, 1564 sq ft, built 1971 | $203,000 | $1,999 | $285 | 10.13% |
| 209 Chapel Lake S | Single family – 3 bed, 3 bath, 1700 sq ft, built 2006 | $309,900 | $2,199 | $180 | 7.82% |
| 210 Westminister Rd | Single family – 3 bed, 2 bath, 1633 sq ft, built 1980 | $287,000 | $2,126 | $39 | 8.73% |
| 28 Heritage Way | Single family – 5 bed, 3 bath, 2784 sq ft, built 2004 | $395,000 | $2,999 | $40.67 | 8.99% |
4. Chattanooga, Tennessee
Cap rates are roughly 6.8% to 8.5% in Chattanooga.
Table 4: Recently sold properties in Chattanooga, TN
| Street Address | Description | Price | Rental Zestimate | Monthly HOA Fees | Annual Net Rent-to-Price Ratio |
| 4104 Gayle Dr | Single family – 3 bed, 3 bath, 2350 sq ft, built 1960 | $325,000 | $2,400 | Unknown (assuming none) | 8.86% |
| 1211 Sholar Ave | Single family – 3 bed, 1 bath, 1377 sq ft, built 1930 | $185,000 | $1,642 | Unknown (assuming none) | 10.65% |
| 1052 N Orchard Knob Ave | Single family – 3 bed, 2 bath, 1756 sq ft, built 1920 | $250,000 | $2,254 | Unknown (assuming none) | 10.82% |
| 711 Snow St | Single family – 3 bed, 2 bath, 1391 sq ft, built 1940 | $273,000 | $2,146 | Unknown (assuming none) | 9.43% |
| 6240 E Brainerd Rd | Single family – 3 bed, 2 bath, 1800 sq ft, built 1951 | $250,000 | $2,050 | Unknown (assuming none) | 9.84% |
5. Atlanta, Georgia
Cap rates are roughly 4.7% to 9.0% in Atlanta.
Table 5: Recently sold properties in Atlanta, GA
| Street Address | Description | Price | Rental Zestimate | Monthly HOA Fees | Annual Net Rent-to-Price Ratio |
| 60 Bates Ave SE | Single family – 4 bed, 3.5 bath, 3528 sq ft, new construction (2023) | $1.18 Million | $6,162 | Unknown (assuming none) | 6.27% |
| 1689 Derry Ave SW | Single family – 4 bed, 4 bath, 2425 sq ft, built 1945 | $450,000 | $3,452 | None | 9.21% |
| 3991 Adamsville Dr SW | Single family – 3 bed, 1 bath, 1016 sq ft, built 1964 | $150,000 | $1,431 | Unknown (assuming none) | 11.45% |
| 1017 Dean Dr NW | Single family – 3 bed, 3 bath, 2258 sq ft, built 1951 | $1.05 Million | $5,408 | Unknown (assuming none) | 6.18% |
| 1280 W Peachtree St NW Apt 3609 | Condo – 2 bed, 2 bath, 1028 sq ft, built 1989 | $340,000 | $2,429 | $555 | 6.61% |
6. Cave Creek, Arizona
Cap rates are roughly 3.5% to 4.9% in Cave Creek.
Table 6: Recently sold properties in Cave Creek, AZ
| Street Address | Description | Price | Rental Zestimate | Monthly HOA Fees | Annual Net Rent-to-Price Ratio |
| 4519 E Duane Ln | Single family – 3 bed, 2 bath, 2083 sq ft, built 1992 | $625,000 | $3,200 | $26.33 | 6.09% |
| 4536 E Hunter Court | Single family – 4 bed, 2 bath, 2310 sq ft, built 1995 | $785,000 | $3,300 | $26.33 | 5.00% |
| 29852 N 43rd Way | Single family – 4 bed, 2.5 bath, 2931 sq ft, built 1992 | $1,032,500 | $4,635 | $26.33 | 5.36% |
| 26630 N 45th Pl | Single family – 4 bed, 2.5 bath, 2582 sq ft, built 1996 | $762,500 | $3,200 | $39 | 4.97% |
| 26614 N 47th St | Single family – 5 bed, 3 bath, 3744 sq ft, built 1997 | $918,000 | $4,428 | $37.33 | 5.74% |
7. Columbus, Ohio
Cap rates are roughly 3.5% to 7.5% in Columbus.
Table 7: Recently sold properties in Columbus, OH
| Street Address | Description | Price | Rental Zestimate | Monthly HOA Fees | Annual Net Rent-to-Price Ratio |
| 871 Crevis Ln | Single family – 3 bed, 3 bath, 1542 sq ft, built 2001 | $267,000 | $1,944 | Unknown (assuming none) | 8.74% |
| 1347 E 15th Ave | Single family – 3 bed, 1 bath, 1012 sq ft, built 1948 | $170,000 | $1,350 | Unknown (assuming none) | 9.53% |
| 1321 Oakwood Ave | Single family, 2 bed, 1.5 bath, 1032 sq ft, built 1925 | $199,900 | $1,344 | Unknown (assuming none) | 8.07% |
| 65 Sheffield Rd | Single family – 3 bed, 1.5 bath, 1690 sq ft, built 1940 | $520,000 | $2,122 | Unknown (assuming none) | 4.90% |
| 3550 Kirkwood Rd | Single family – 3 bed, 1.5 bath, 1080 sq ft, built 1958 | $202,000 | $1,494 | Unknown (assuming none) | 8.88% |
8. Cincinnati, Ohio
Cap rates are roughly 4.3% to 9% in Cincinnati.
Table 8: Recently sold properties in Cincinnati, OH
| Street Address | Description | Price | Rental Zestimate | Monthly HOA Fees | Annual Net Rent-to-Price Ratio |
| 3849 Washington Ave | Single family – 6 bed, 7 bath, 6594 sq ft, built 1925 | $800,000 | $4,210 | None | 6.32% |
| 2831 Rosella Ave | Single family – 2 bed, 1 bath, 1096 sq ft, built 1890 | $200,000 | $1,999 | None | 11.99% |
| 3116 Troy Ave | Single family – 4 bed, 4 bath, 2063 sq ft, built 1880 | $495,000 | $3,188 | Unknown (assuming none) | 7.73% |
| 3745 Marburg Ave | Single family – 3 bed, 3 bath, 1224 sq ft, built 1936 | $403,000 | $2,324 | None | 6.92% |
| 159 E Mitchell Ave | Duplex – 3626 sq ft, built 1916 | $410,000 | $3,351 | None | 9.81% |
9. Cary, North Carolina
Cap rates are roughly 2.9% to 4.0% in Cary.
Table 9: Recently sold properties in Cary, NC
| Street Address | Description | Price | Rental Zestimate | Monthly HOA Fees | Annual Net Rent-to-Price Ratio |
| 124 Greenmont Ln | Townhouse – 3 bed, 2 bath, 1263 sq ft, built 1987 | $375,000 | $1,794 | $171 | 5.19% |
| 102 Glenhigh Ct | Single family – 5 bed, 4 bath, 3131 sq ft, built 1992 | $830,000 | $3,550 | $884 | 3.85% |
| 208 Wedgemere St | Single family – 3 bed, 3 bath, 2385 sq ft, built 1999 | $623,000 | $2,500 | $70 | 4.78% |
| 207 Beckingham Loop | Single family – 3 bed, 2 bath, 2342 sq ft, built 2007 | $715,000 | $3,218 | $287 | 4.92% |
| 260 Langford Valley Way | Townhouse – 3 bed, 3 bath, 2060 sq ft, built 2009 | $510,000 | $2,175 | $237 | 4.56% |
NOTE: These are not, by any means, the highest cap rates you can get in these markets. This data is only based on a small sample of properties that are currently being sold, and most of these listings were sold to home buyers not investors. By finding the right deal and doing some light renovations, you can increase your cap rate significantly.