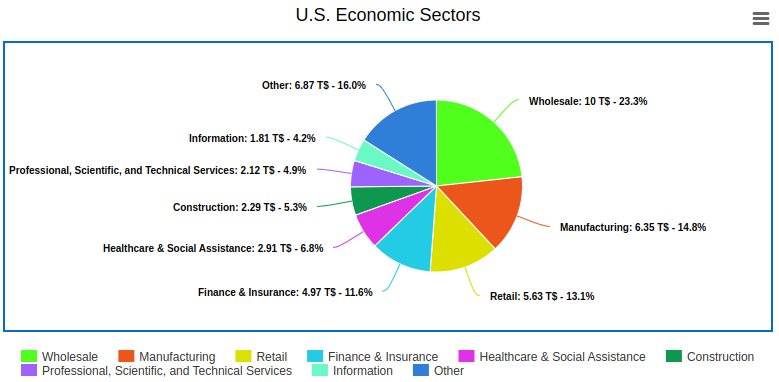
Based on government census and federal reserve data, the biggest U.S. sector by revenue is wholesale trade. Wholesaler companies generated $10 Trillion in gross revenues last year which represents 23.3% of all recorded revenues.
Combined, the biggest 8 out of 19 sectors comprise 84% of total revenues. The exact percentages and revenues (in Trillions of USD) are represented in the pie chart below. Note: These numbers are the sum of revenues of companies in a given sector. They will generally sum to more than GDP because the revenue of a company producing an intermediary product or service is counted in these statistics but is not counted in GDP numbers. Also be aware that these are estimates and do have a margin of error.
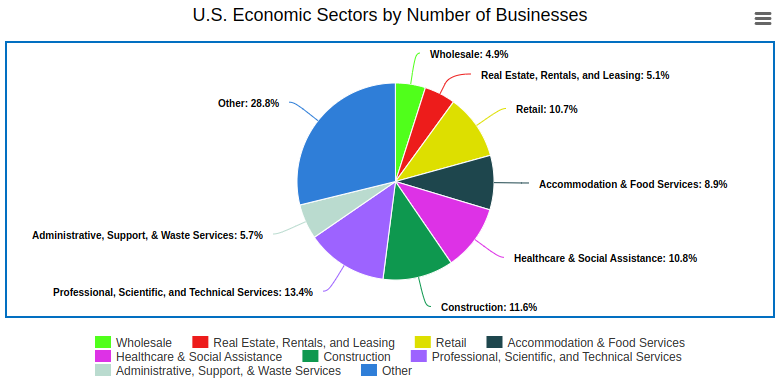
Interestingly, there is a substantial difference between the biggest sectors by revenue and the biggest sectors by number of companies. The professional, scientific, and technical services sector is the single largest industry sector by number of businesses (over 811,000) but is only 7th by total revenues. On the other hand, manufacturing was the second largest sector by total revenues but does not even crack the top 8 by number of businesses. Do note however that these statistics do not include business entities which have no employees (and self-employed individuals do not count as employees).
The total revenues and number of companies for all 18 major business sectors (the 19th is a miscellaneous “other” category that isn’t very informative) are displayed in the table below.
| Sector Description | Sector NAICS Code | Number of Companies | Total Revenues | |
| 18 | Agriculture, Forestry, Fishing and Hunting | 11 | 22,641 | $40.0 Billion |
| 17 | Management of Companies and Enterprises (e.g. offices of bank holding companies, regional & corporate offices of large companies) | 55 | 26,956 | $138 Billion |
| 16 | Arts, Entertainment, and Recreation (includes performing arts companies, theater companies, musical groups and artists, sports teams, agents & managers for artists and athletes, independent writers & performers, museums, zoos, botanical gardens, theme parks, gambling & casino companies, golf courses, skiing facilities, gyms, etc) | 71 | 130,107 | $308 Billion |
| 15 | Mining, Quarrying, and Oil and Gas Extraction | 21 | 19,080 | $464 Billion |
| 14 | Educational Services (includes private schools, colleges, universities, and professional schools, professional & management development training, trade schools, flight training, athletic training, exam prep & tutoring services, language schools, and educational support services) | 61 | 93,500 | $472 Billion |
| 13 | Utilities | 22 | 5957 | $656 Billion |
| 12 | Real Estate, Rentals, and Leasing (includes e.g. rented and leased equipment & vehicles, not just real estate) | 53 | 309,369 | $764 Billion |
| 11 | Transportation & Warehousing | 48-49 | 185,028 | $1.02 Trillion |
| 10 | Accommodation & Food Services (includes hotels, RV parks, campgrounds, restaurants, food delivery & catering services, etc) | 72 | 539,886 | $1.08 Trillion |
| 9 | Administrative, Support, Waste Management, and Remediation Services (e.g. employment services, temp help services, professional employer organizations, document prep services, call centers, telemarketing services, private mail carriers, collection agencies, credit bureaus, travel arrangement & planning services, security services, facility cleaning & maintenance services, waste collection & treatment services, etc) | 56 | 347,829 | $1.10 Trillion |
| 8 | Information (e.g. publishers, video production, music production, TV & Radio, telecommunications, data processing & hosting, software publishers, web search, etc) | 51 | 79,662 | $1.81 Trillion |
| 7 | Professional, Scientific, and Technical Services (e.g. legal services, accounting services, consulting services, architectural & engineering services, testing laboratory services, design services, IT services, marketing & advertising services, PR services, veterinary services (but not medical services), and R&D services) | 54 | 811,320 | $2.12 Trillion |
| 6 | Construction | 23 | 701,477 | $2.29 Trillion |
| 5 | Health Care & Social Assistance (e.g. hospitals, doctors, dentists, nursing homes, social workers, therapists, etc) | 62 | 655,069 | $2.91 Trillion |
| 4 | Finance & Insurance | 52 | 238,408 | $4.97 Trillion |
| 3 | Retail Trade | 44-45 | 647,927 | $5.63 Trillion |
| 2 | Manufacturing | 31-33 | 248,039 | $6.35 Trillion |
| 1 | Wholesale Trade | 42 | 298,127 | $10.0 Trillion |
You might be wondering how wholesale trade can generate almost twice the revenue of retail trade. After all, doesn’t everything sold by a wholesaler go to a retailer who then sells it for even more? I’ll answer this as well as explain the main revenue contributors to each sector in the section below.
What are the biggest U.S. industry sectors by revenue? (Explained)
1. Wholesale Trade
The $10 Trillion in wholesale revenue is primarily driven by 5 product categories:
- Over $1 Trillion in wholesaled vehicles, vehicle parts, and vehicle supplies
- Over $1 Trillion in wholesaled drugs, creams, ointments, lotions, cosmetics, perfumes, and toiletries
- Over $1 Trillion in wholesaled groceries and related products
- Over $1 Trillion in wholesaled petroleum products
- Almost $1 Trillion in wholesaled household appliances and electronics
Additionally, about $800 Billion in revenue was generated by wholesale agents, brokers, and marketplaces.
The reason that the total revenue of the wholesale sector can be larger than the total revenue of the retail sector is that wholesalers do not just connect manufacturers and retailers but also connect different manufacturers working on different stages of the manufacturing process as well as manufacturers and other wholesalers. This means that the total revenue number can effectively count the same item multiple times as it is assembled by various manufacturers and transported to a final retailer.
2. Manufacturing
The over $6 Trillion manufacturing sector revenue is primarily driven by 3 product categories:
- Over $1 Trillion in transportation equipment
- Almost $1 Trillion in food products
- Almost $1 Trillion in chemical products
Like wholesalers, manufacturers can also sell intermediate parts to other manufacturers which means the total revenue number is inflated over what you’d find if you were to only look at net manufacturing output.
3. Retail Trade
The almost $6 Trillion retail sector revenue is driven by many product categories, but three of the largest are:
- Over $1.3 Trillion in cars and car parts
- Over $1 Trillion in food & beverage
- Almost $500 Billion in building materials and garden equipment
Perhaps surprisingly to tech-minded people, the total retail sales for online shopping is only about a tenth of the total retail revenue, and over of half of that is attributable to Amazon. This is actually more impressive than it seems however since the total retail number includes vehicle sales.
4. Finance & Insurance
The $5 Trillion finance & insurance sector is driven almost entirely by three main categories:
- Over $2.6 Trillion from insurance (the vast majority of which is insurance carrier revenue with brokers and agents only bringing in a small fraction of the total)
- About $1.5 Trillion from credit intermediation & related activities (this includes commercial banking, credit unions, credit cards, sales financing, consumer lending, trade financing, mortgage brokering, etc)
- Almost $700 Billion from securities, commodity contracts, and related investment activities
5. Health Care & Social Assistance
The almost $3 Trillion health care & social assistance sector has 2 primary revenue drivers and 2 secondary revenue drivers that together constitute almost the entire sector:
- Over $1 Trillion from hospitals
- Over $1 Trillion from other outpatient care (e.g. doctor offices, dentists, medical diagnostics, family planning centers, chiropractors, mental health services, etc)
- About $275 Billion from nursing & residential care facilities
- About $225 Billion from social assistance (e.g. services for the elderly and people with disabilities, child day care services, vocational rehab services)
Custom Industry Reports
Whether you’re an investor, consultant, banker, executive, or analyst, great decisions require great data and great data-derived insights. Before investing in a new line of business for example, you’ll want to answer questions such as:
- What is the market size of this industry?
- What are the adjacent markets?
- How well does the industry perform during recessions?
- Is the industry growing or shrinking? How quickly?
- How profitable are companies in this industry?
- How capital intensive is this industry?
- What financial benchmarks should be used to understand a company’s performance in this industry? What are typical values for those financial benchmarks (including all standard financial ratios)?
- Who are the main competitors in this industry?
- What do supply chains look like in this industry?
- What are the financial strengths & weaknesses of companies historically in this industry?
- What macroeconomic and cultural trends are affecting this industry or might affect this industry (either positively or negatively)?
- Are there any legal or tax advantages or handicaps in this industry?
- What are the most likely risks to this industry?
- What are some of the long-tail (black swan) risks in this industry? E.g. what kind of technologies, regulatory changes, tax changes, geopolitical conflicts, geological disasters, weather disasters, fire disasters, biological disasters, (e.g. diseases of humans, animals, or plants), flood disasters, solar flare disasters, or cultural shifts in preferences would be necessary to severely disrupt the industry?
We answer all of those questions and also provide extensive data, data visualizations, and forecasts in our custom industry reports. Unlike some companies which charge $1000 for organized census data without real analysis, we give organized census data away for free (e.g. this article). Meanwhile our custom reports provide actual insights, rating checklists for businesses in a given industry, and benchmarking models in addition to tons of data, charts, and diagrams (20+ pages worth in total!) And they’re cheaper too.
A few interesting examples of industries we have analyzed in the past include:
- Industrial waste remediation
- Life insurance
- For-profit sports teams
- Management consulting
- Residential rental property management
- TikTok influencers
- Social media marketing agencies
- HVAC service contractors
- Tortilla manufacturing
And many others. Our reports also come with a 30-day guarantee. If our research doesn’t help you solve your problem, we’ll make it right or give you a full refund because we believe research is only as useful as the decisions it helps you make.