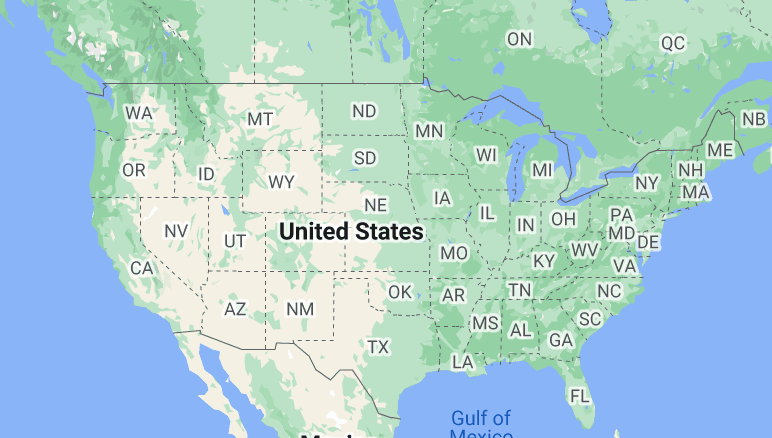
These are the 50 U.S. counties with the lowest percentage of families making under $25,000 a year. That means the counties are generally well-off, have low unemployment, and have low homeless populations.
| Rank | County | Total Number of Families | Families Making Under $25k/yr |
| 1 | Manassas Park city, VA | 3,735 | 1.5% |
| 2 | Falls Church city, VA | 3,643 | 1.6% |
| 3 | Morgan County, UT | 3,127 | 1.9% |
| 4 | Douglas County, CO | 97,704 | 2.1% |
| 5 | Summit County, CO | 6,564 | 2.2% |
| 6 | Nantucket County, MA | 2,822 | 2.4% |
| 7 | Broomfield County, CO | 19,027 | 2.5% |
| 8 | Loudoun County, VA | 106,343 | 2.7% |
| 9 | Hunterdon County, NJ | 36,066 | 2.8% |
| 10 | Grant County, SD | 2,139 | 2.8% |
| 11 | Stafford County, VA | 39,177 | 2.9% |
| 12 | Los Alamos, NM | 5,127 | 2.9% |
| 13 | Ouray County, CO | 1,342 | 3.0% |
| 14 | Pitkin County, CO | 3,675 | 3.0% |
| 15 | Elbert County, CO | 7,504 | 3.1% |
| 16 | Grand County, CO | 3,491 | 3.1% |
| 17 | Pawnee County, KS | 1,228 | 3.2% |
| 18 | Carver County, MN | 28,393 | 3.2% |
| 19 | Hamilton County, NE | 2,664 | 3.3% |
| 20 | Garza County, TX | 1,220 | 3.3% |
| 21 | Delaware County, OH | 58,366 | 3.3% |
| 22 | York County, VA | 18,631 | 3.4% |
| 23 | Hamilton County, IN | 95,327 | 3.4% |
| 24 | Spencer County, KY | 5,556 | 3.5% |
| 25 | Clear Creek County, CO | 2,459 | 3.5% |
| 26 | Williamson County, TN | 66,539 | 3.5% |
| 27 | Mason County, TX | 1,135 | 3.5% |
| 28 | Fluvanna County, VA | 7,218 | 3.6% |
| 29 | Goochland County, VA | 6,951 | 3.7% |
| 30 | Ozaukee County, WI | 25,165 | 3.7% |
| 31 | Kendall County, IL | 33,954 | 3.7% |
| 32 | Gray County, KS | 1,542 | 3.8% |
| 33 | Scott County, MN | 40,233 | 3.8% |
| 34 | Washington County, MN | 71,034 | 3.8% |
| 35 | St. Charles County, MO | 108,688 | 3.8% |
| 36 | Sherburne County, MN | 24,755 | 3.8% |
| 37 | Morris County, NJ | 132,067 | 3.8% |
| 38 | Waukesha County, WI | 113,296 | 3.9% |
| 39 | Somerset County, NJ | 89,782 | 3.9% |
| 40 | Washington County, WI | 38,883 | 3.9% |
| 41 | Union County, OH | 16,175 | 4.0% |
| 42 | Rockwall County, TX | 29,369 | 4.0% |
| 43 | Sioux County, IA | 8,748 | 4.0% |
| 44 | Poquoson city, VA | 3,759 | 4.0% |
| 45 | Monroe County, IL | 9,978 | 4.1% |
| 46 | Jefferson County, KS | 4,999 | 4.1% |
| 47 | Hancock County, IN | 22,036 | 4.1% |
| 48 | Calvert County, MD | 24,408 | 4.1% |
| 49 | Deuel County, SD | 1,229 | 4.1% |
| 50 | Woodford County, KY | 7,402 | 4.1% |
Methodology: Counties with under 1000 resident families are excluded from this ranking. Counties that are part of territories (e.g. Puerto Rico) are also excluded. The data used for the ranking comes from the Census’ 5-year American Community Survey income estimates for 2021. First, we rank by the percentage of families making less than $25k per year (in 2021). We then break ties by the percentage of families making less than $15k per year. Remaining ties are then broken by the percentage of families making less than $10k per year. Finally, ties that still exist are broken by comparing median family income. Notably, this is not the same way that “poverty” is traditionally defined, nor does it account for regional differences in cost of living.